9 July 2022
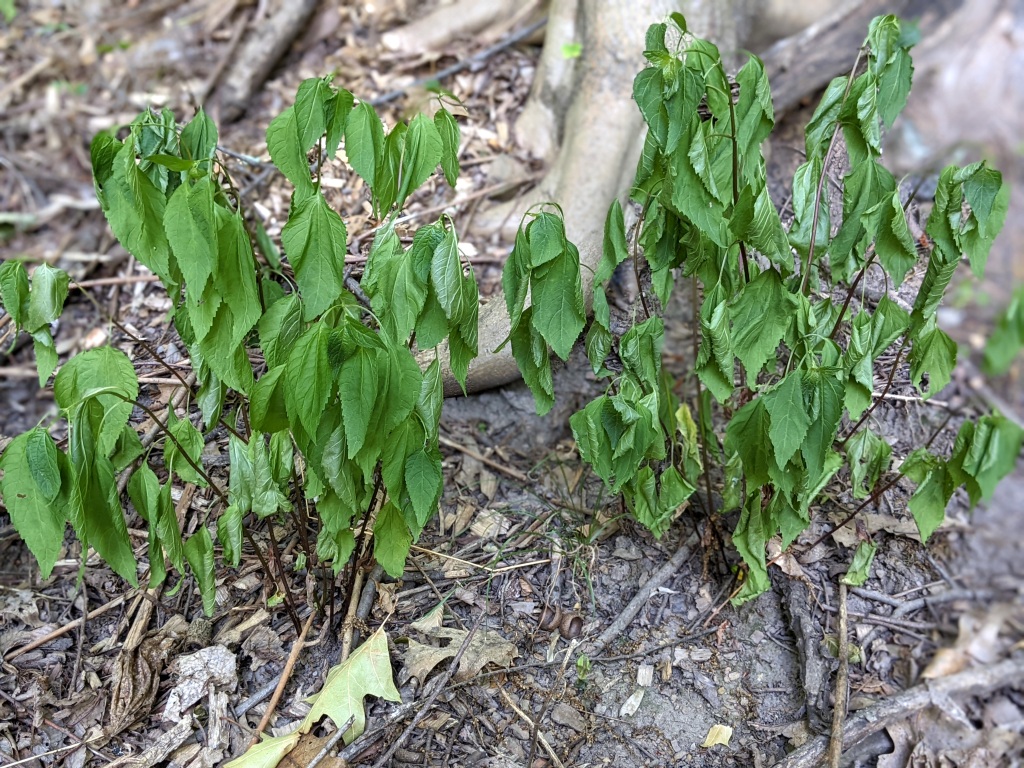
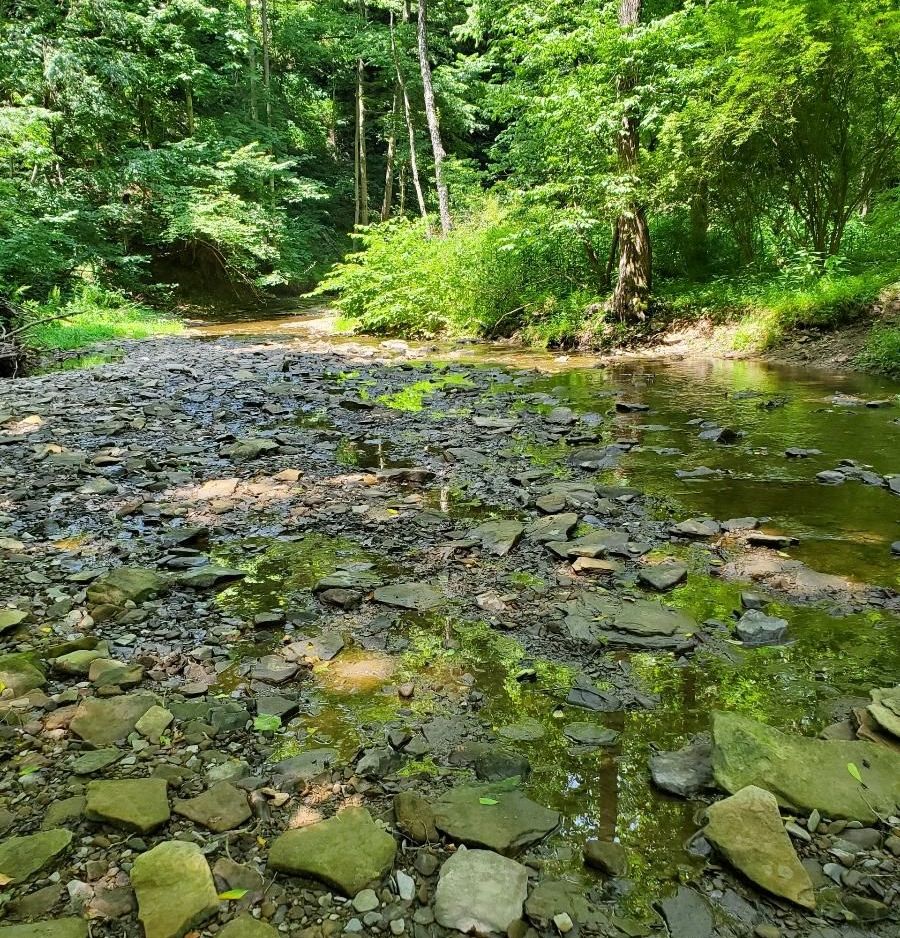
Hot dry weather since early June has turned the grass brown and caused low water in Pittsburgh area streams. By the Fourth of July leaves were wilting in Schenley Park and Little Sewickley’s creek bed was exposed at Sneed’s.

Precipitation had changed in only five weeks from 1.20 inches above normal at the end of May to -1.58 inches below normal on 4 July. A thunderstorm on 6 July reduced the deficit to -1.24 inches below normal this morning. (See statistics at the NWS Pittsburgh Local Climate page.)
Are we in a drought?
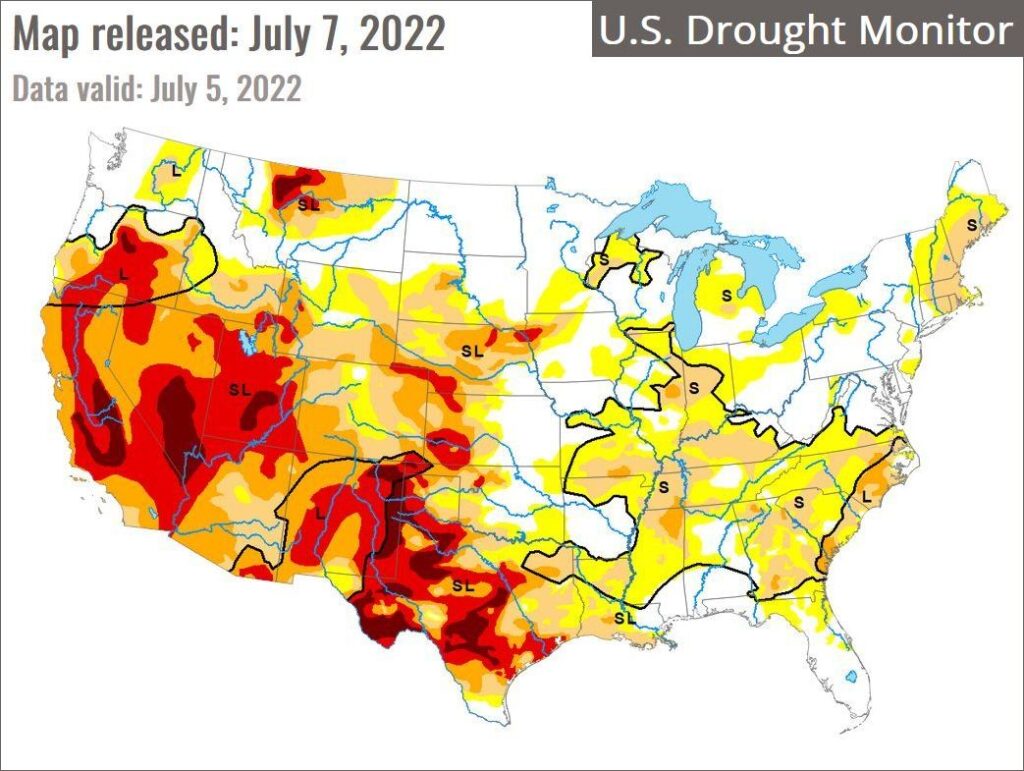
Not really. Despite wilting leaves this week’s U.S. Drought Monitor map puts most of Pennsylvania in the normal range. (S=short-term impacts, L=long term impacts)

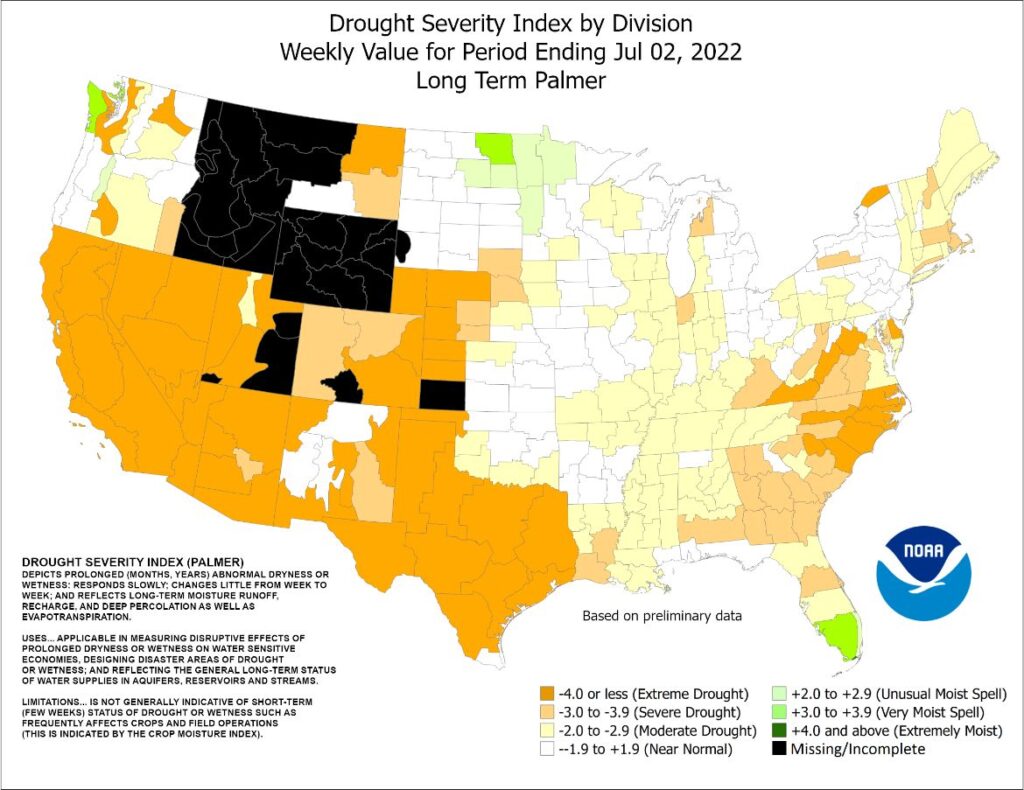
The Drought Severity Index (Long Term Palmer) map, below, is both predictive and more fine grained. It shows a hint of drought in four southwestern Pennsylvania regions (pale yellow) and extreme drought in the U.S. West and Southwest (orange). The surprise to me is the extreme long term drought in eastern North and South Carolina, evident on both drought maps. Northeastern North Carolina needs 12 inches of rain to get back to normal (click here for the map).

It’s reassuring to know that Pittsburgh is not heading for severe drought. I feel bad for all the areas colored scary red and orange.
(photos by Kate St. John and Karyn Delaney, maps from US Drought Monitor at UNL and NOAA Climate Prediction Center)