24 January 2023
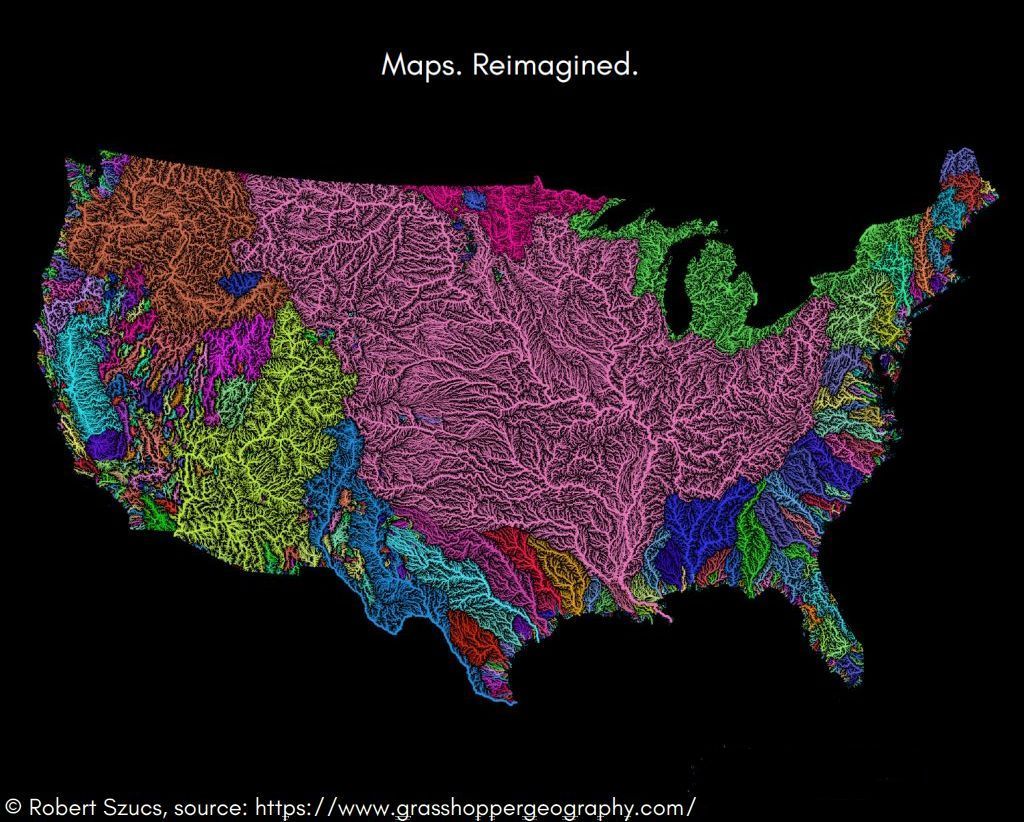
About ten years into his career as a digital cartographer Robert Szucs decided to experiment with data visualization and learned how to create strikingly beautiful, digitally accurate maps. He calls them “Maps Reimagined” and explains,
While my maps are always scientifically accurate, I think of them first and foremost as works of art.
— Robert Szucs, Grasshopper Geography Press Kit
His watershed maps became an Internet sensation a few years ago through digital sales on Etsy and news outlets including the Washington Post and Smithsonian Magazine.
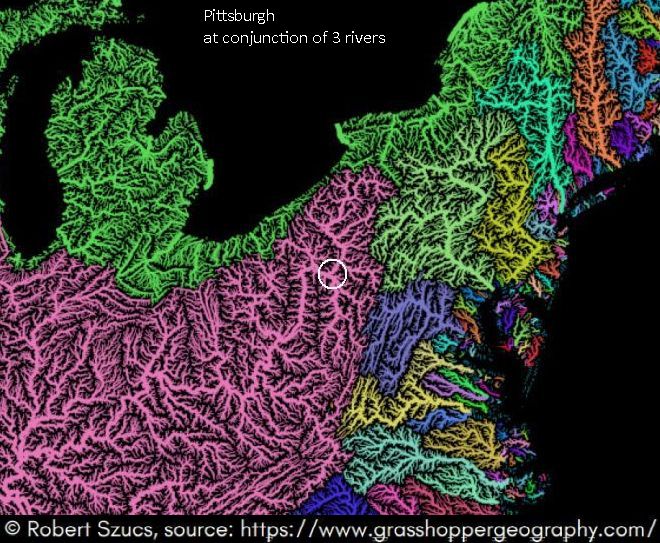
The U.S. watershed map above is so detailed that you can pinpoint Pittsburgh in the Mississippi watershed at the conjunction of the Allegheny, Monongahela and Ohio Rivers.

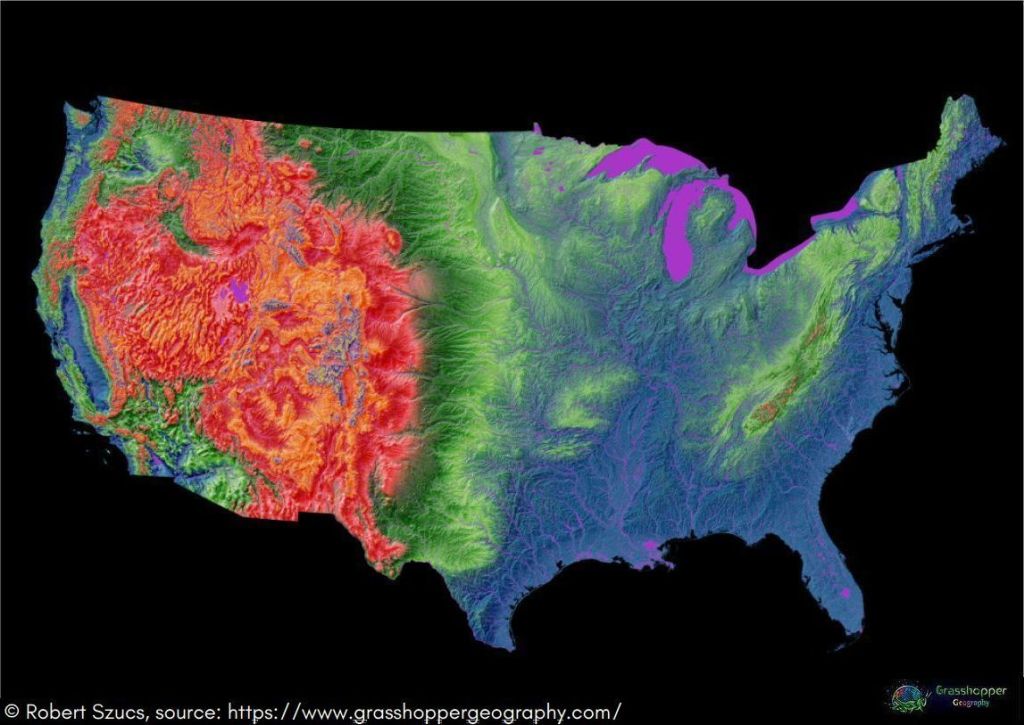
Szucs has also produced collections of elevation, forest and human population maps.
There came a point when I said I can’t look at another green-brown-white elevation map again. I needed some fun. I needed colours. And for not the first or last time, I needed to create the maps I wanted to see.
— Robert Szucs, Grasshopper Geography Press Kit
This one dramatically illustrates that even the plateaus in the U.S. West are much higher than anything in the East.

See more maps and learn more about them at GrasshopperGeography.com.
I sent this entry to my sister, and she wrote back: “Oh, those are pretty. They would make good coloring books, with different kinds of things being represented…” (Not to mention educational!) The wind maps on your 1.26.2023 entry are pretty, too.