5 March 2025
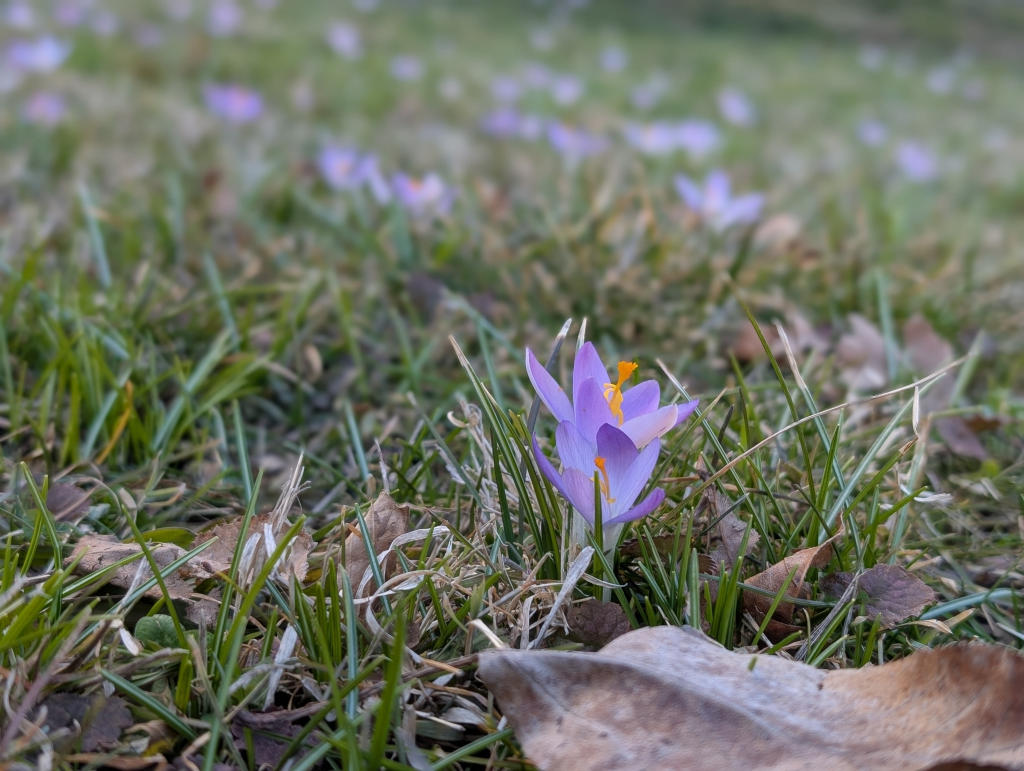
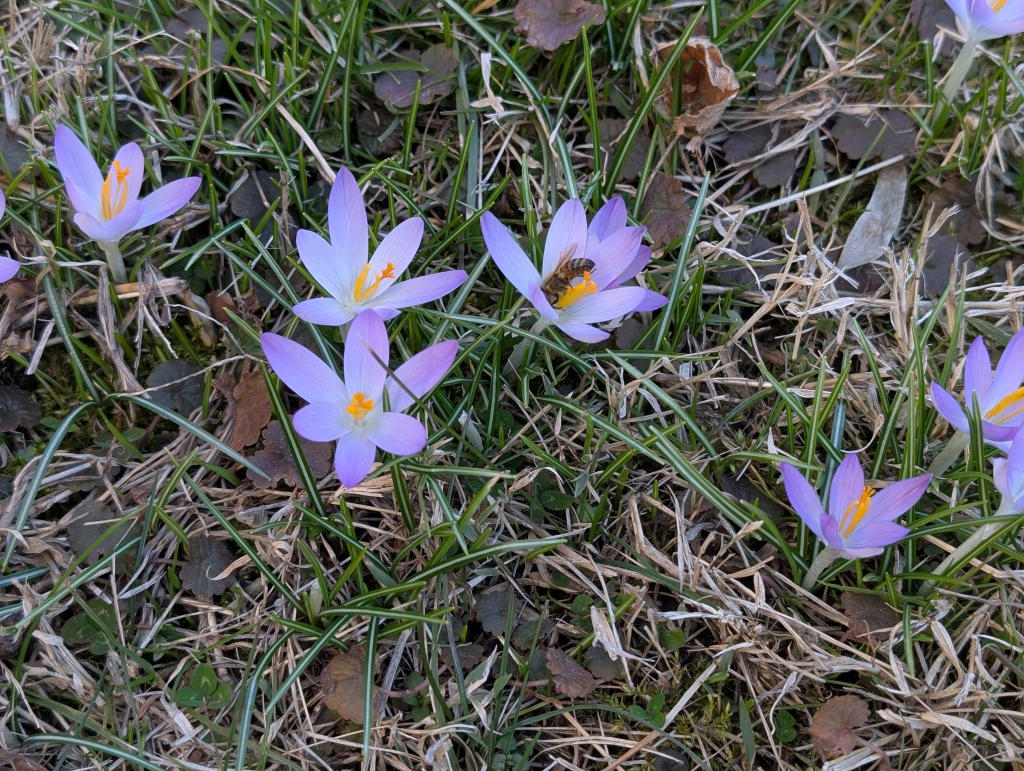
The crocuses are blooming!
But of course they are. In yesterday’s sunny and unseasonably warm 67°F the woodland crocuses (Crocus tommasinianus) on Neville Street were in full bloom. I say “were” because today’s rain, clouds and wind will probably keep them closed.
The crocuses dotted the lawn, above, and opened their petals to the sun.
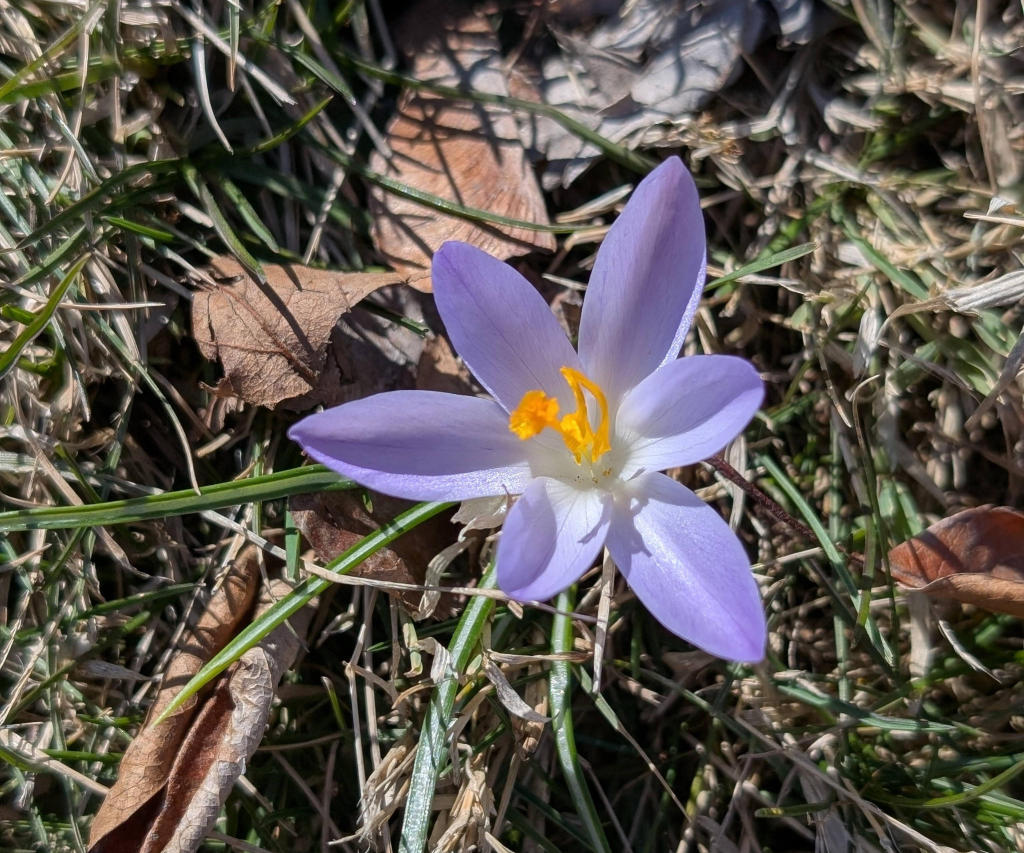
Honeybees came to take a sip.
Now that they’ve opened, how does this year’s crocus bloom date compare to those in the past? Is it later than usual because we had such a cold winter?
Surprisingly, this year is on the early end of the spectrum, based on my record of Crocus First-Bloom Dates in Pittsburgh’s East End since 2009.
- March 11, 2009
- March 11, 2010
- March 14, 2011
- February 28, 2012 (the Hot year!)
- March 18, 2013
- March 22, 2014 (the Polar Vortex year. Crocuses bloomed for only one day because a deep freeze returned on March 23.)
- March 18, 2015
- I don’t have a crocus record but the date was probably March 7, 2016 based on temperature data, this post about coltsfoot, and feedback from Supriya in Squirrel Hill.
- March 1, 2017
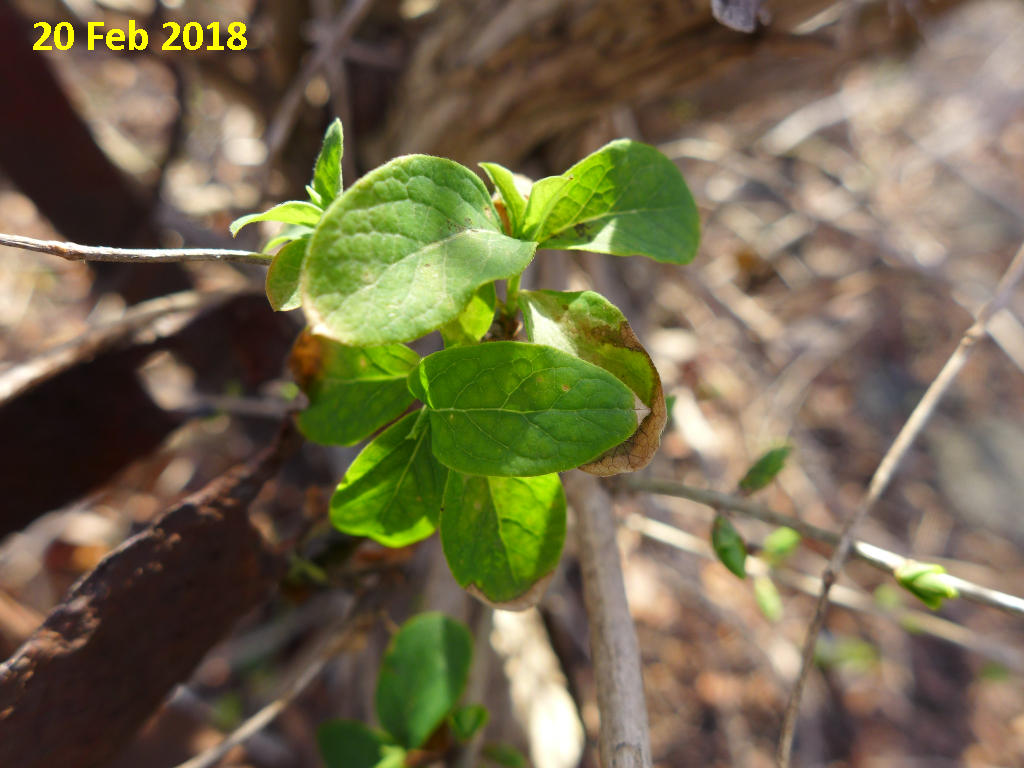
- February 23, 2018
- March 20, 2019
- March 21, 2020
- March 9, 2021
- March 7, 2022
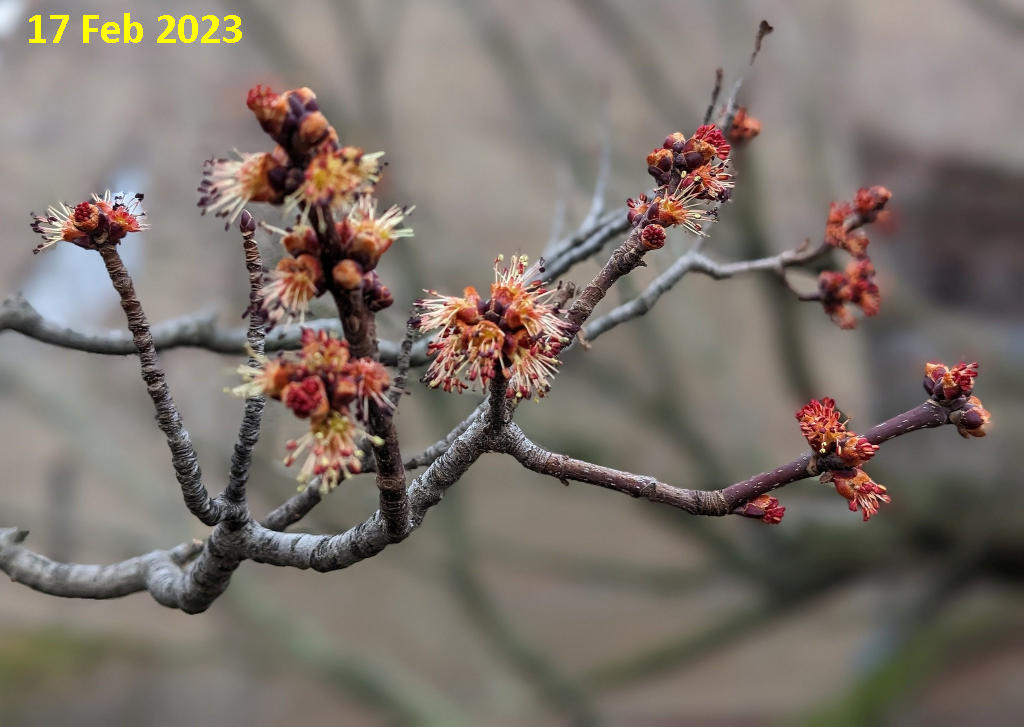
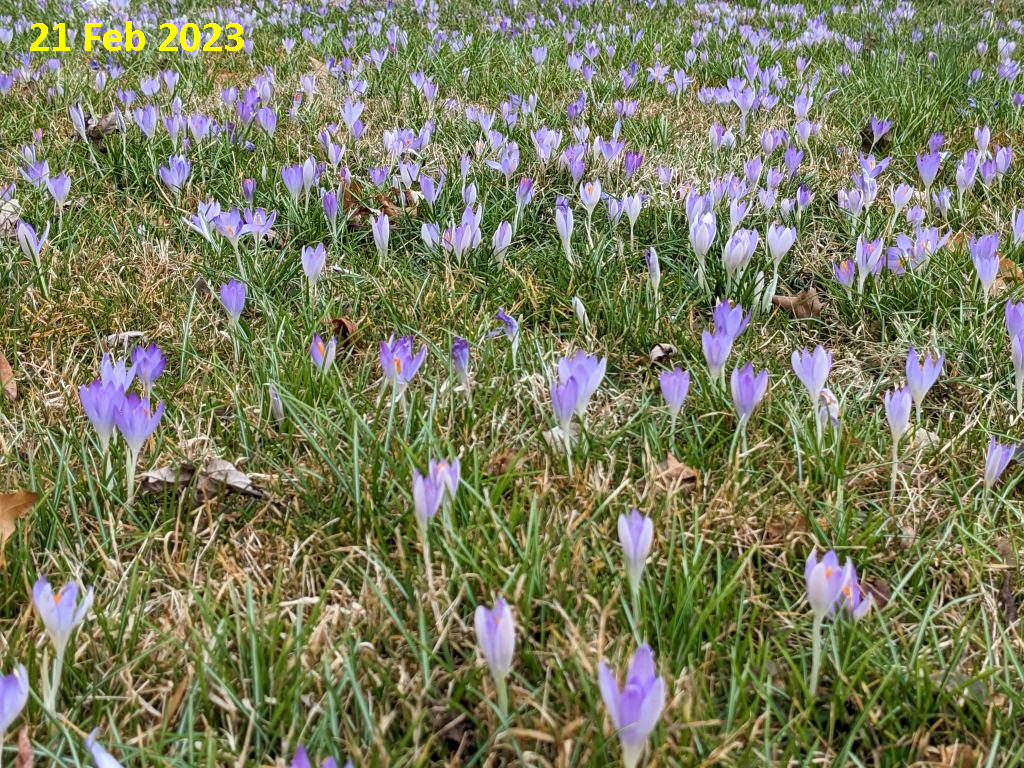
- February 21, 2023 (an Even Hotter year)
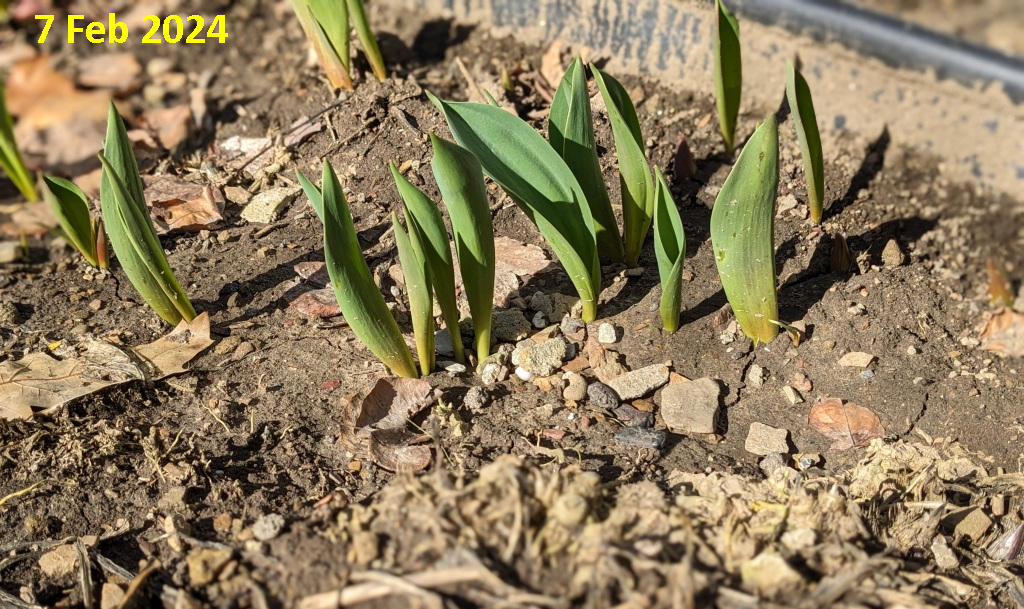
- March 1, 2024
- and this year … March 4, 2025
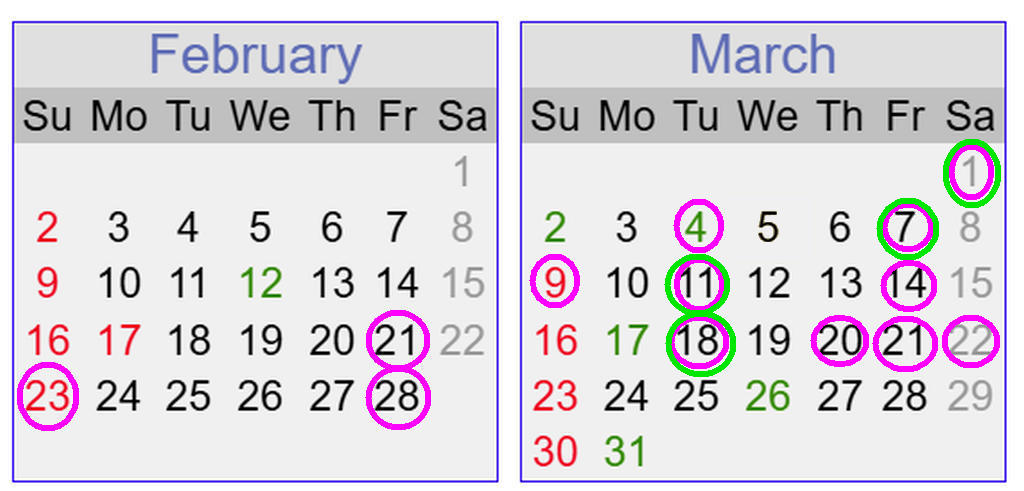
Plotted on the calendar it’s easy to see that the dates cluster and the outliers are early, not late. Repeated dates are circled twice. Interestingly, the dates in February become earlier each time they occur.
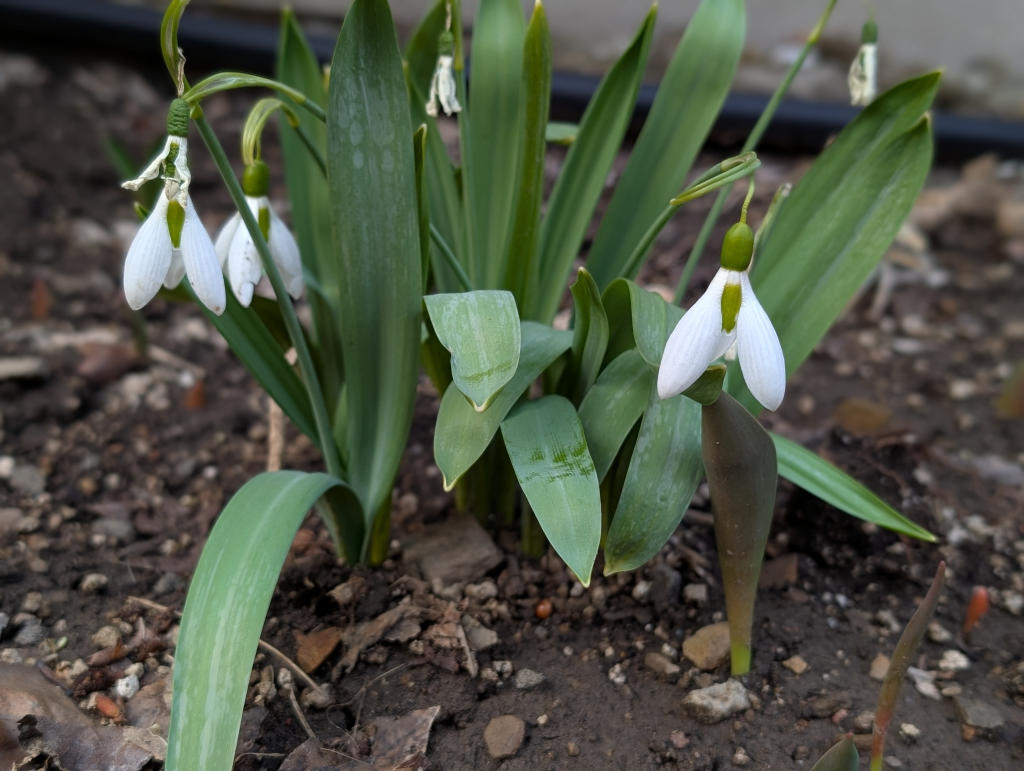
And the crocuses are not alone. Snowdrops are blooming too.