Category Archives: Climate Change

Future Summers Will Last Half The Year

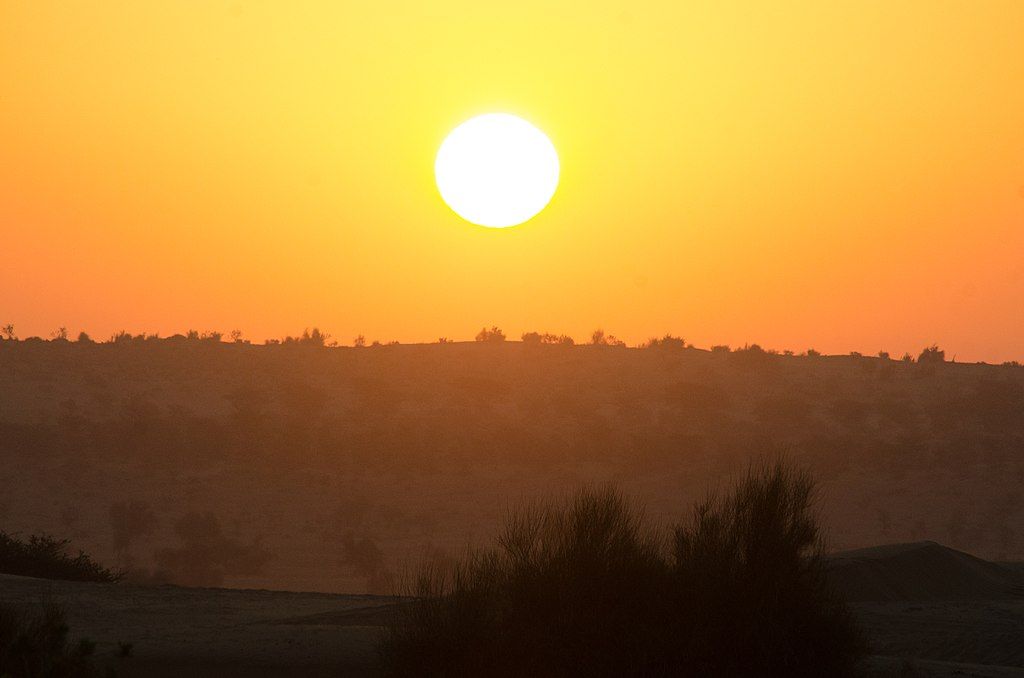
Hot summer sun (photo from Wikimedia Commons)

20 July 2021

Withering heat, parching drought, devastating floods, dangerous wildfires.

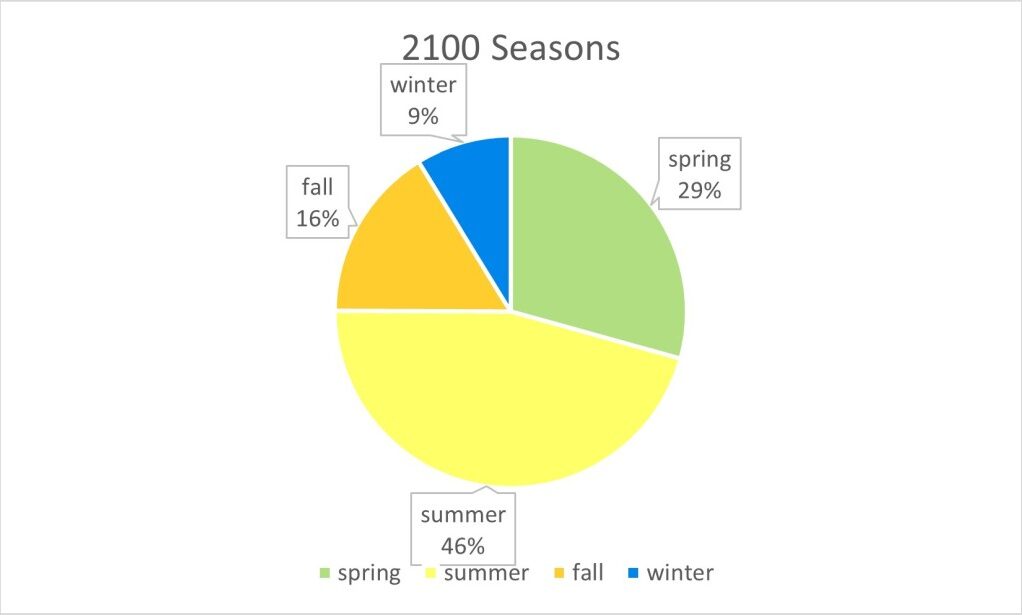
As unpleasant as this summer has been in the Northern Hemisphere we comfort ourselves that better weather will arrive with autumn in September. But even that is changing. A new study published in Geophysical Research Letters predicts that by the end of this century winter, spring and fall will retreat while summer will last nearly half the year.

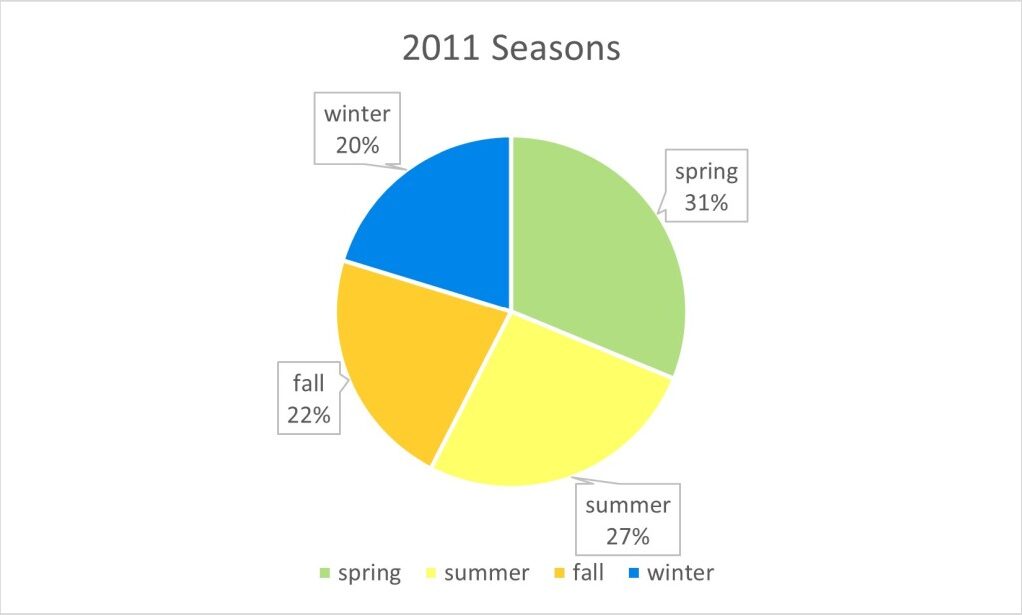
For perspective on the future the researchers studied the past across the Northern Hemisphere, specifically the length of seasons from 1952 to 2011. They set the parameters for summer as the “onset of temperatures in the hottest 25% during that time period, while winter began with temperatures in the coldest 25%.” Spring and fall filled the gaps.

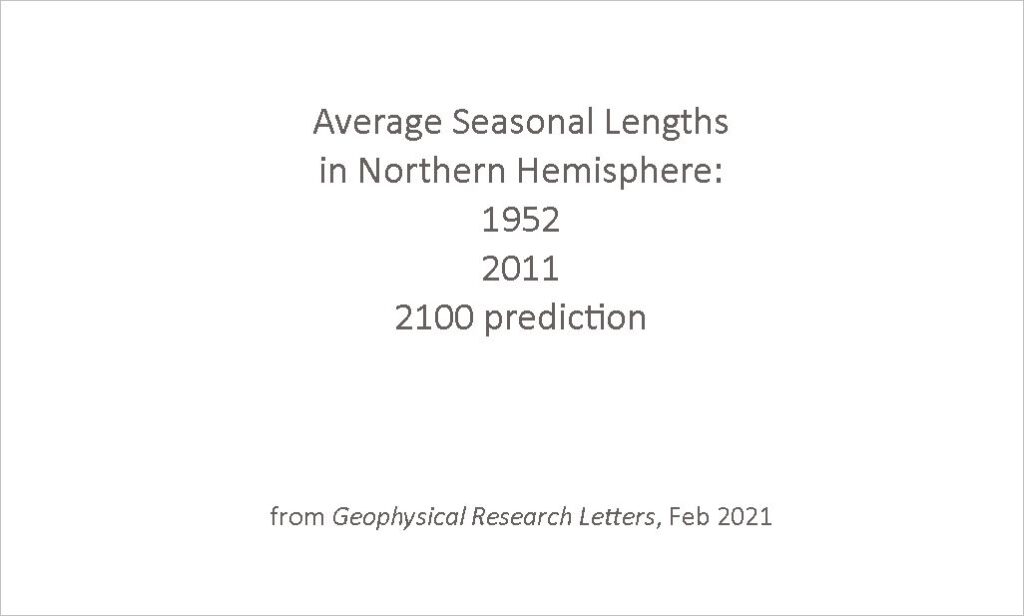
During those sixty years, summers got longer while the other seasons shrank. The slides below show the historical seasons 1952 and 2011 plus the study’s prediction for the year 2100. By then summer will run from May to October.

Average seasonal lengths in Northern Hemisphere, information from Phys.org

For those of you who don’t like winter this sounds like a great idea but the reality will be unsettling. The long summers and short winters will continue to have extreme temperature and precipitation swings with stunning storms like those we’ve seen in recent years. Imagine the heat of July lasting three months or more.

Meanwhile pleasant days will become scarce. My favorite seasons, spring and fall, will be shorter.

Our great-grandchildren will live in a very different world.

Read more and see the large version of this animation at Northern hemisphere summers may last nearly half the year by 2100 at Phys.org.

(photo from Wikimedia Commons, simple pie charts by Kate St. John, embedded animation from Phys.org)
Going Dry

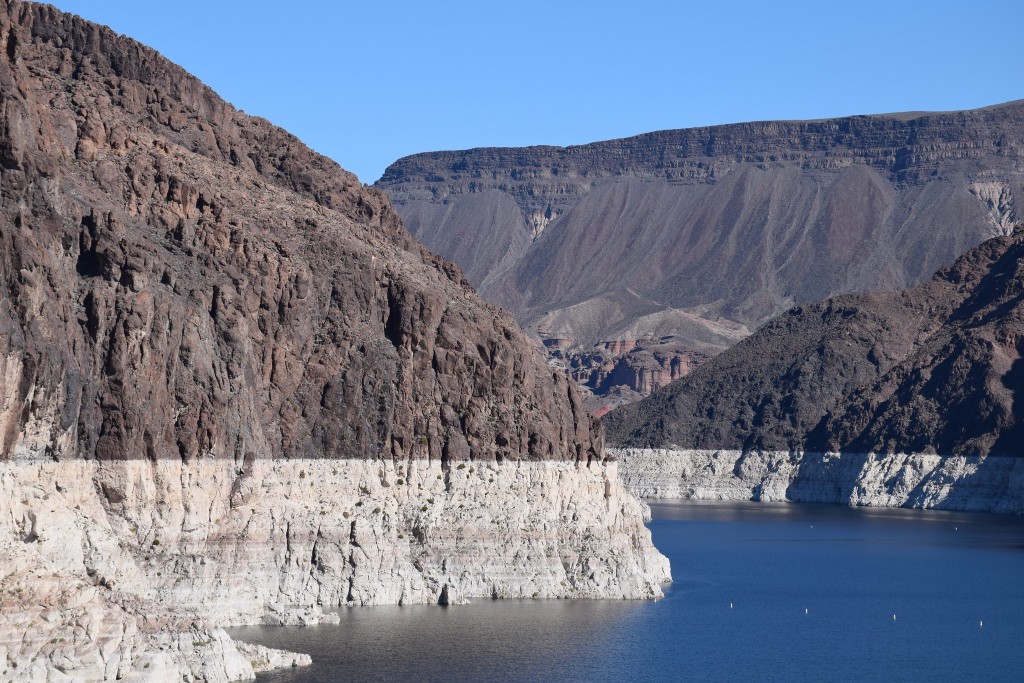
Lake Mead bathtub ring, Feb 2017 (photo by Karen on Flickr Creative Commons license)

15 July 2021

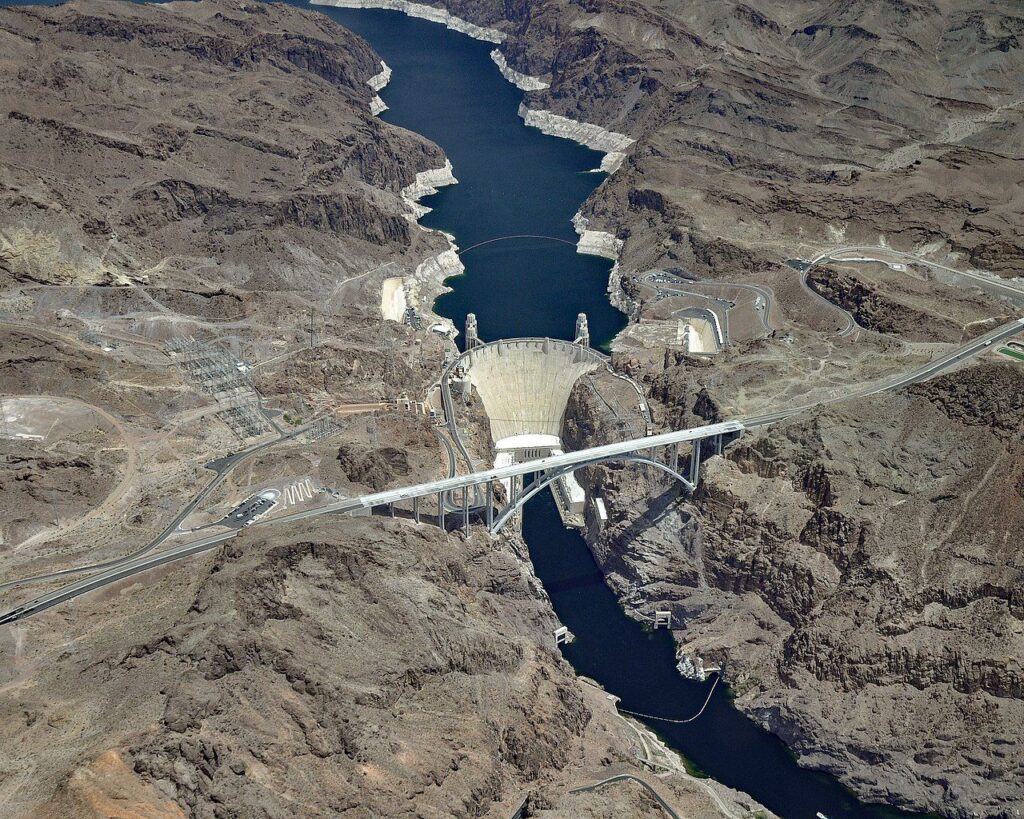
This month a curious discovery in 2014 that predicted low water in the Colorado River and Lake Mead has come to alarming fruition. Lake Mead is going dry.

Lake Mead and Hoover Dam aerial view, May 2013 (photo from Wikimedia Commons)

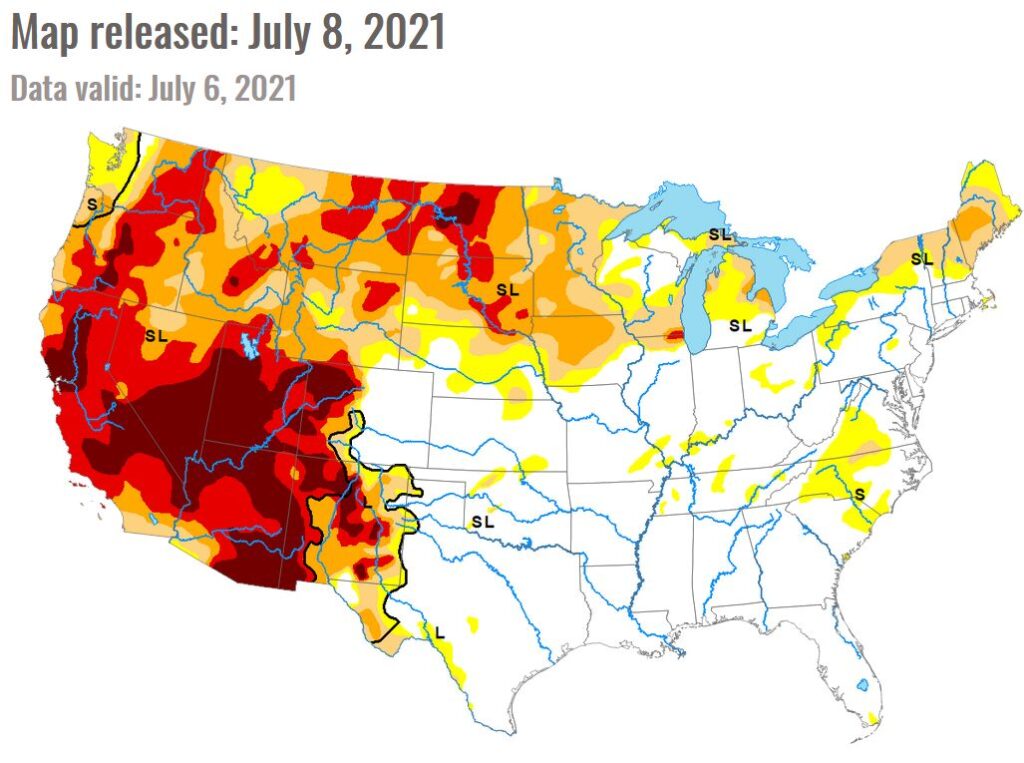
The 20 year drought in the U.S. West is now severe, shown on the U.S. Drought Monitor map below.

Drought Monitor as of 8 July 2021 (image from U.S. Drought monitor, unl.edu)

Consequently the Colorado River is running very low and Lake Mead reached a crisis point last month. The Guardian reports:

In June [2021], the level of Lake Mead plunged below 1,075ft, a point that will trigger, for the first time, federally mandated cuts in water allocations next year. …

Should second tier cuts occur, Arizona will lose nearly a fifth of the water it gets from the Colorado River. Nevada’s first-round cut of 21,000 acre-ft (an acre-ft is an acre of water, one foot deep) is smaller, but its share is already diminutive due to an archaic allotment drawn up a century ago when the state was sparsely populated.

The Guardian: Severe drought threatens hoover dam reservoir and water for us west

The crisis is due to lack of precipitation but we learned in 2014 that loss of rain and snow is dwarfed by the depletion of groundwater.

Using nine years of NASA’s GRACE satellite data from the Colorado River Basin, UC Irvine and NASA scientists made an alarming discovery.  From December 2004 to November 2013 the watershed lost 53 million acre-feet of water, an amount almost twice the size of Lake Mead.  More than 75% of that loss was from groundwater.  No one knows how much water is underground but it’s going fast.

Outside My Window: Even Less Water Than We Thought

It’s a little spooky to see such a recent discovery come to pass so soon. Learn about the discovery in this vintage blog: Even Less Water Than We Thought.

Read about the current situation at: Severe Drought Threatens Hoover Dam Reservoir — and Water for U.S. West.

(photos from Wikimedia Commons, drought map from US Drought Monitor; click on the captions to see the originals)

Flash Floods Every Day

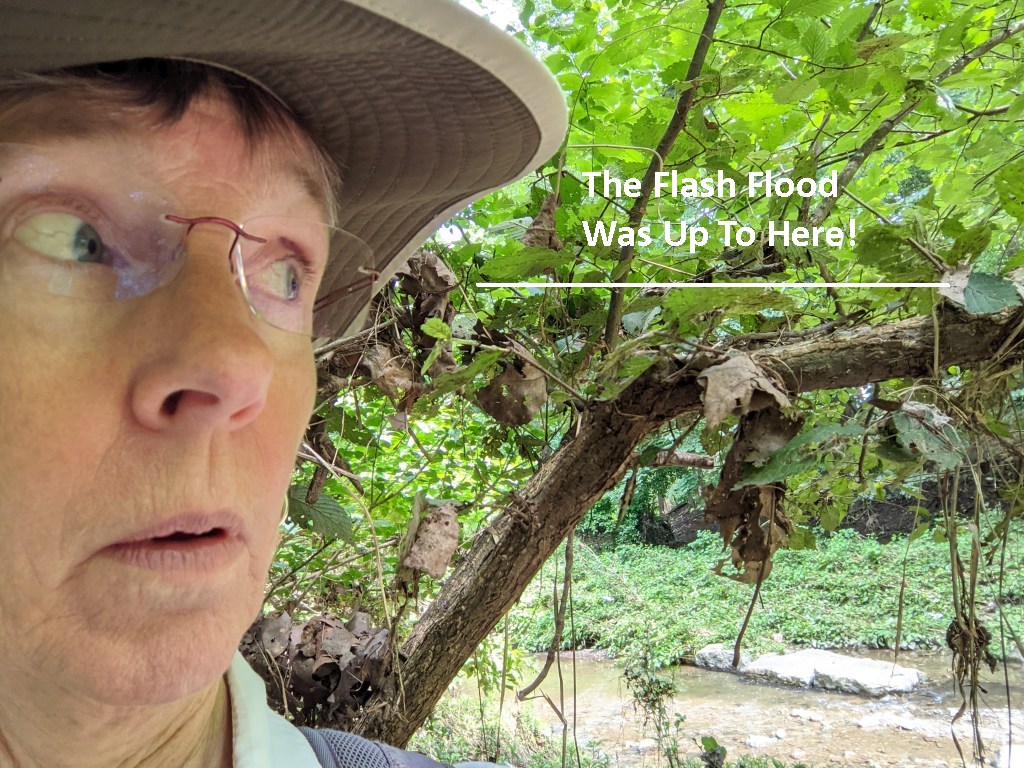
Flash floods on Nine Mile Run last week left flood debris up to my ears! (photo by Kate St. John taken on 10 July 2021)

11 July 2021

Southwestern Pennsylvania has always been prone to flash floods but last week was exceptional with a flash flood every day, three days in a row.

At 3pm on Wednesday 7 Jul 2021 a heavy downpour in the Nine Mile Run watershed caused a flash flood recorded by Upstream Pittsburgh‘s stream cam (video below, blurry because it’s raining). The downpour was so localized to the East End that it did not register on Pittsburgh’s official weather gauges. Flood debris showed that if I’d been on the Nine Mile Run Trail the water would have been up to my ears! (photo at top taken at 40.4263341,-79.9068387).

07 July 2021 Storm Timelapse at Nine Mile Run from Aaron Birdy on Vimeo.

On Thursday 8 July at 7pm a downpour over Pleasant Hills had devastating results as reported by CBS Pittsburgh.

video from CBS Pittsburgh on YouTube

And on Friday 9 July another localized thunderstorm let loose for half an hour in Squirrel Hill. I have no photos because I was driving down Braddock Avenue in the downpour, hoping the river on the road would not become a car-swallowing lake under the Parkway bridge. Fortunately the water ran off into Nine Mile Run. Another flash flood. I’m glad I was not on the trail.

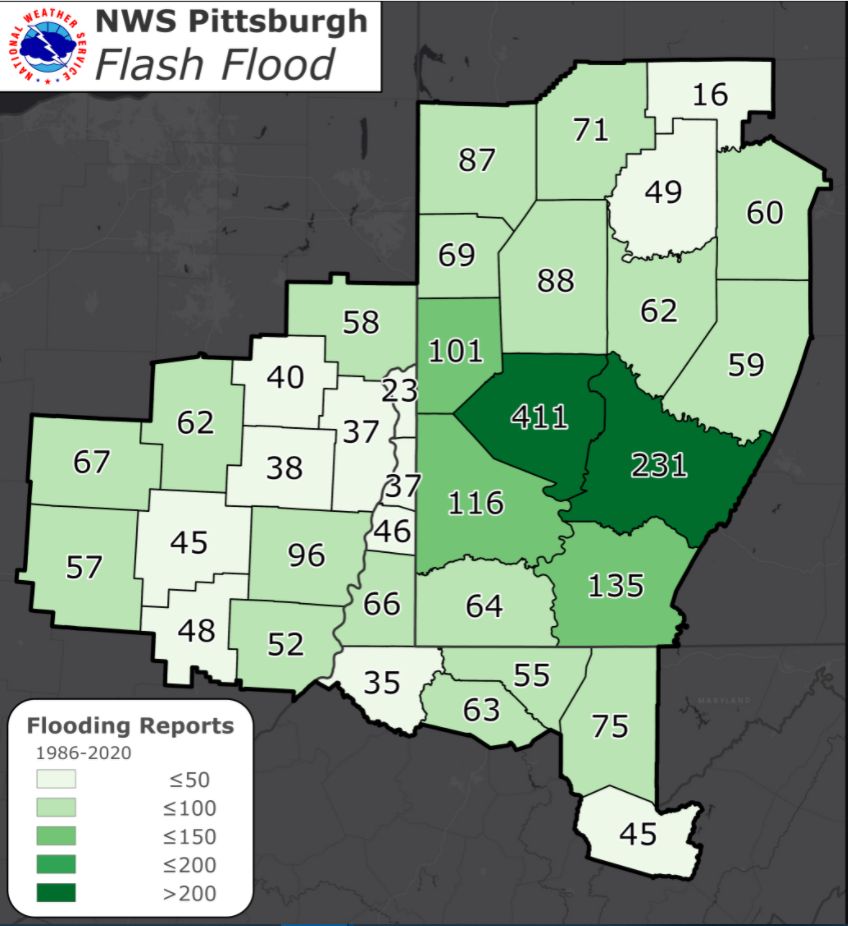
As crazy as this is, it should not be a surprise. Pittsburgh is prone to flash floods, especially in Allegheny County as shown in the 35-year map of Flash Flood Reports from the National Weather Service.

Number of flash floods in 35 years by county, 1986-2020, in NWS Pittsburgh forecast area (image from NWS Pittsburgh)

We don’t need a particularly wet year for this to happen. Pittsburgh’s 2021 rainfall is actually 0.93 inches below normal as of today. The problem is that the rain falls all at once, especially in June and July.

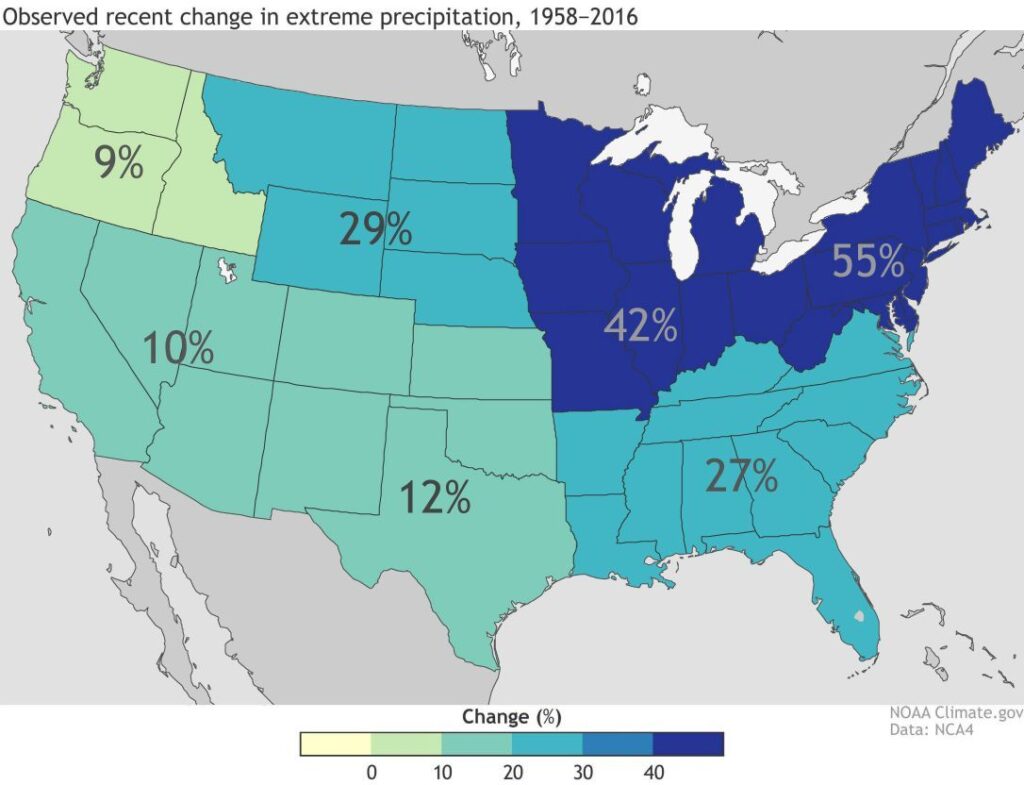
Climate change is making the problem worse. A 2019 study found that extreme precipitation has increased 55% in the Northeastern US in my lifetime.

Heavy rain has increased across most of the United States, 1986-2016 (map from climate.gov)

This trend will continue in southwestern PA through the 21st century. (Click here to see where frequent heavy downpours will increase in the U.S.)

Brace yourself, Pittsburgh, for a lot of flash floods in the future. Sometimes every day.

About Nine Mile Run per Upstream Pgh (formerly Nine Mile Run Watershed Association): “Nine Mile Run is a small stream that flows through Pittsburgh’s East End, mostly underground. The 7 square mile Nine Mile Run watershed is home to the largest urban stream restoration in the United States, completed by the U.S. Army Corps of Engineers in 2006.” Upstream Pgh got its start with this project and now works throughout the region on community-oriented stormwater management projects, large and small, plus much more. Click here for their website.

p.s. If you’re not from the area you might not realize that “Pgh” is an abbreviation for Pittsburgh. We’re the only Pittsburgh with an “h.”

(photo by Kate St. John, videos from Upstream Pittsburgh and CBS Pittsburgh, maps from NWS Pittsburgh an climate.gov; click on the captions to see the originals)

Air Then and Now

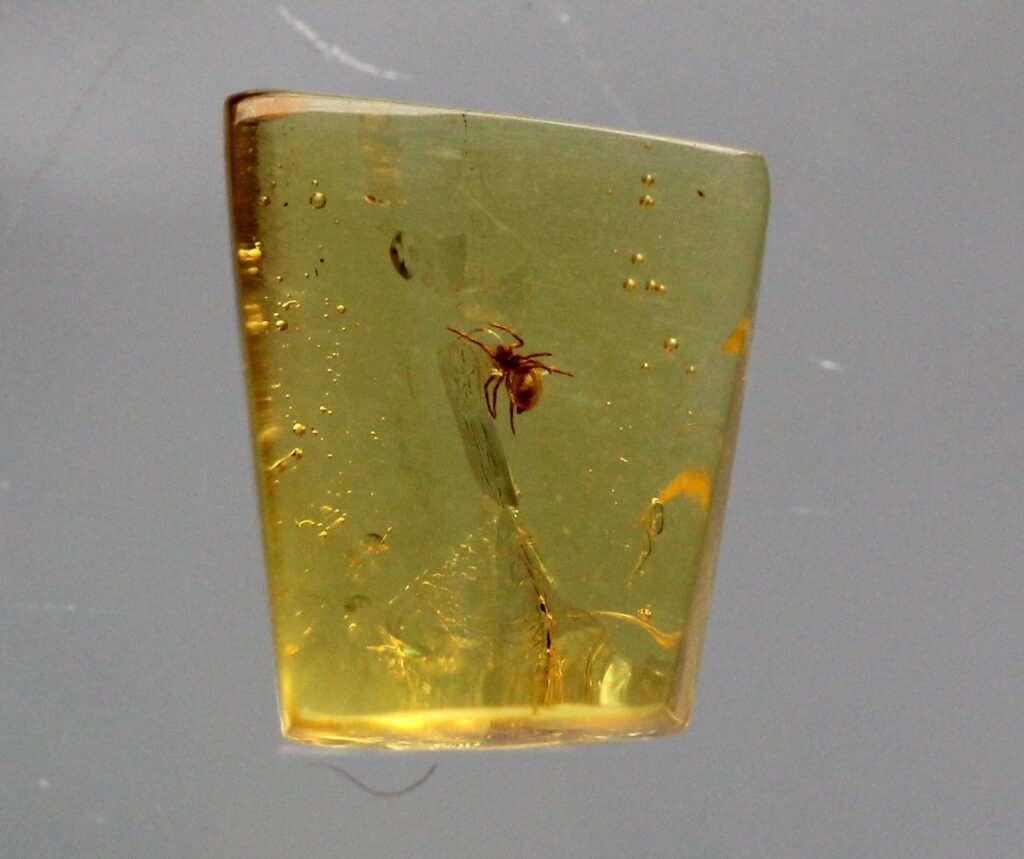
50 million year-old spider and air trapped in amber (photo from Wikimedia Commons)

22 April 2021

If you want to know what the air was like 100 million years ago, look at the air trapped in amber. In 2013 scientists analyzed 538 samples and discovered that in the age of the dinosaurs there was less oxygen in the air than now. The concentration in the early Cretaceous period was only 10-15% compared to 21% oxygen today. It was similar to the available oxygen at Mount Everest Base Camp.

If you want to know what the air is like now in the U.S. check the 22nd annual State of the Air Report issued yesterday by the American Lung Association (ALA). Sadly, Pittsburgh is still in the top 10 of Bad Air cities for year-round particle pollution.

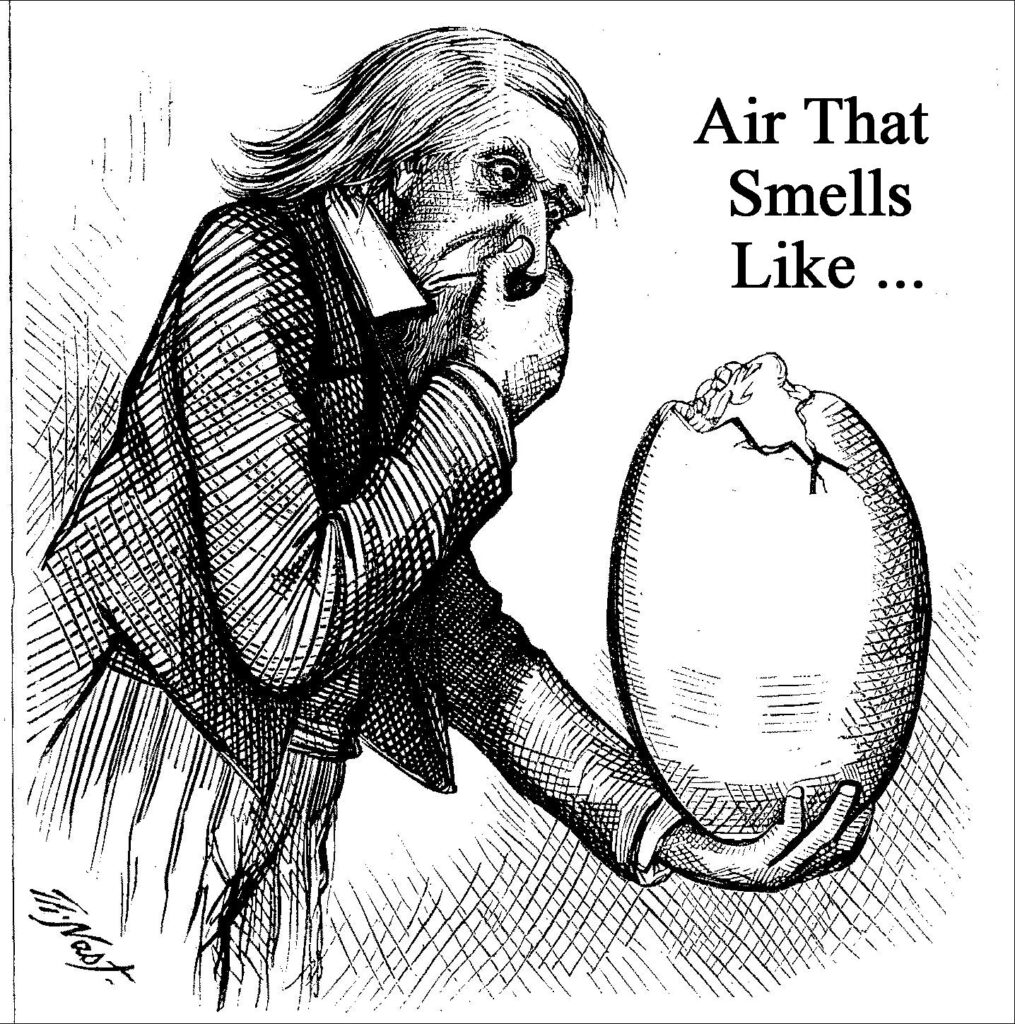
The State of the Air Report doesn’t even measure the rotten egg smell — hydrogen sulfide, H2S — that’s produced by U.S. Steel’s Clairton Coke Works and Edgar Thompson Works in Braddock.

High concentrations of H2S (widely recognized by its foul, rotten-egg odor) are registered all too often in the Mon Valley. In fact, so far this year there have already been 21 exceedances of Pennsylvania’s 24-hour average H2S standard – 13 at the Liberty monitor and eight more at the North Braddock monitor. 

GASP-pgh.org, State of the Air Report, 21 April 2021

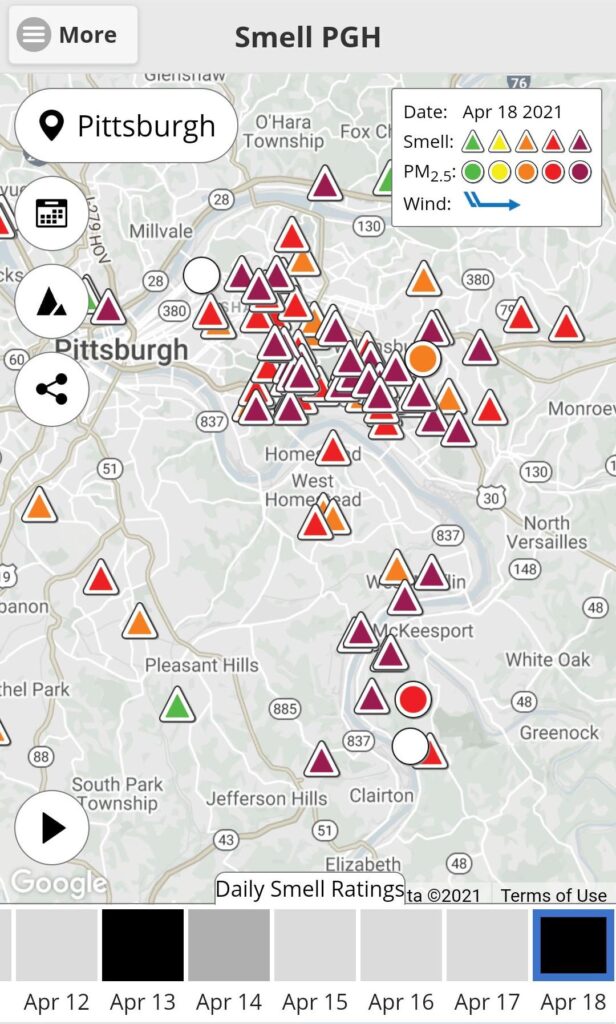
This month has been especially bad. Here’s what it looked like last Sunday 18 April on Smell PGH’s crowd-sourced bad smell report.

In Pittsburgh, the nose knows.

That rotten egg smell (Tammany cartoon via Wikimedia Commons, text removed)

Read more about the air the dinosaurs breathed in this vintage blog: Ancient Air.

Read more about Pittsburgh air quality (Pittsburgh area air quality still gets failing grades) and what you can do about it at the Group Against Smog and Pollutiongasp-pgh.org.

p.s. The scientific paper about the air-in-amber research is here: https://www.sciencedirect.com/science/article/abs/pii/S0016703713003906

(photos from Wikimedia Commons, Smell PGH screenshot from the app; click on the captions to see the originals)

What’s Changed In 7 Years?

Ruddy duck in breeding plumage (photo from Wikimedia Commons)

8 April 2021

About once a week I look back seven years to highlight an old blog post that is still interesting today. This morning when I looked back, I was stunned at how different spring is now in southwestern PA compared to April 2014. A lot has changed in seven years. Migrating ducks, singing frogs and flowers are showing up earlier in 2021. For instance …

Have you seen a lot of ruddy ducks lately? Seven years ago the bulk of their migration through Moraine State Park began on 5 April 2014. This year it started almost a month earlier on 11 March 2021 and is basically over now. Here’s the 2014 blog post that caught my attention: Ruddy Bubbles. Click on the hotspot icons here to see this year’s ruddy duck activity at Moraine.

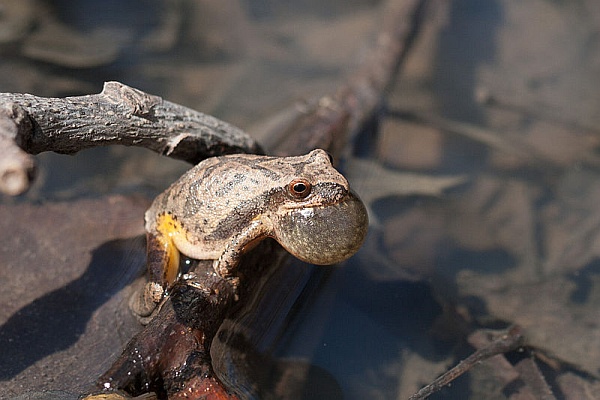
Have you heard spring peepers or wood frogs calling lately? Seven years ago they were loud on 6 April 2014 (Jeepers Creepers) but this year their peak was on 12 March 2021 at Racooon Wildflower Reserve: Sights and Sounds of Early Spring. When I returned to Raccoon twelve days later the frogs were quieter. They were silent on 4 April 2021.

Spring peeper calling in the Ozarks (photo by Justin Meissen via Wikimedia Commons)

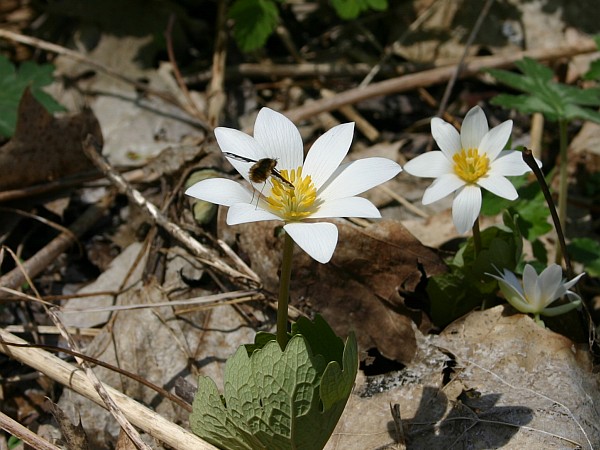
On 31 March 2021 I found bloodroot and hepatica blooming at Cedar Creek: Before The Freeze. Seven years ago they bloomed a couple of weeks later on 12 April 2014: It Was Fun While It Lasted.

Bloodroot blooming at Cedar Creek Park, Westmoreland County, 19 April 2014 (photo by Kate St. John)
Bloodroot blooming at Cedar Creek Park, Westmoreland County, 12 April 2014 (photo by Kate St. John)

What’s changed in seven years? The climate is warmer. Nature is responding.

It will be interesting to see what happens next.

(photos from Wikimdeia Commons and by Kate St. John)

Birds Decline, Small Mammals Thrive in a Hotter World

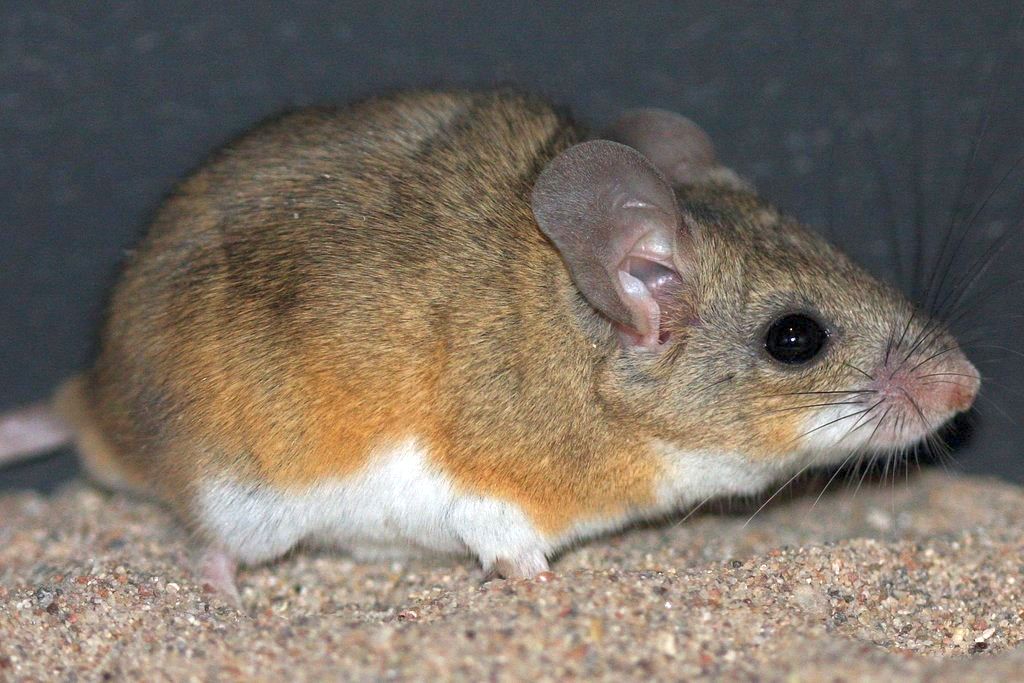
Cactus mouse (photo by J.N. Stuart, Creative Commons license via iNaturalist)

8 March 2021

What is the future of life on Earth as the climate warms? Which species will thrive and which decline? A study published last month in Science indicates that “in a warming world, it’s better to be a small mammal than a bird.”

In the early 1900’s Joseph Grinnell made extremely detailed records of flora and fauna in California’s Mojave Desert for the Museum of Vertebrate Zoology. A century later the average temperature in the Mojave is now 2oC (3.6oF) higher. Using Grinnell’s records a team led by Eric Riddell resurveyed Grinnell’s locations to find out how birds and mammals fare in hotter, drier conditions.

If you like birds, you won’t like the news.

[In the Mojave Desert] Over the past century, occupancy of small mammals remained stable while birds severely declined.

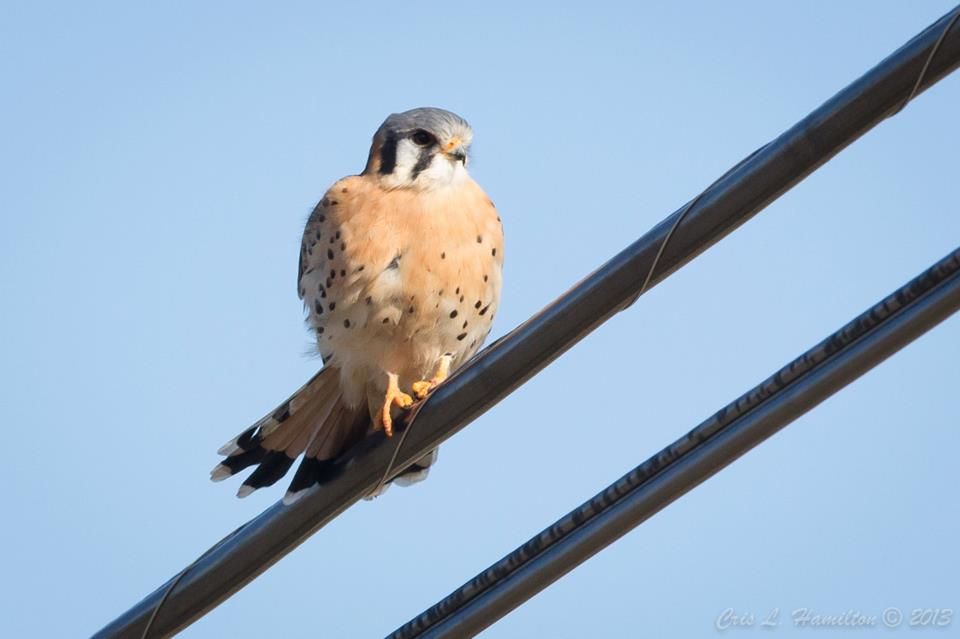
On average, every spot surveyed had lost more than 40% of its desert bird species, such as American kestrels or mountain quail. At most sites, even the remaining species were scarcer.

Science Magazine: In a warming world it’s better to be a small mammal than a bird.
American kestrel, 2013 (photo by Cris Hamilton)

Small mammals get around the heat problem by staying underground during the day. Birds don’t have this choice and they have an additional disadvantage — their bodies use more energy to stay cool.

It looks like there will be fewer birds in a hotter world. Read more in Science Magazine: In a warming world it’s better to be a small mammal than a bird.

p.s. There is a bird who stays underground during the day and eats small mammals in the Mojave Desert: the burrowing owl.

(cactus mouse photo by J. N. Stuart via iNaturalist (CC BY-NC-ND), American kestrel photo by Cris Hamilton)

Won’t Live Where It’s Hot

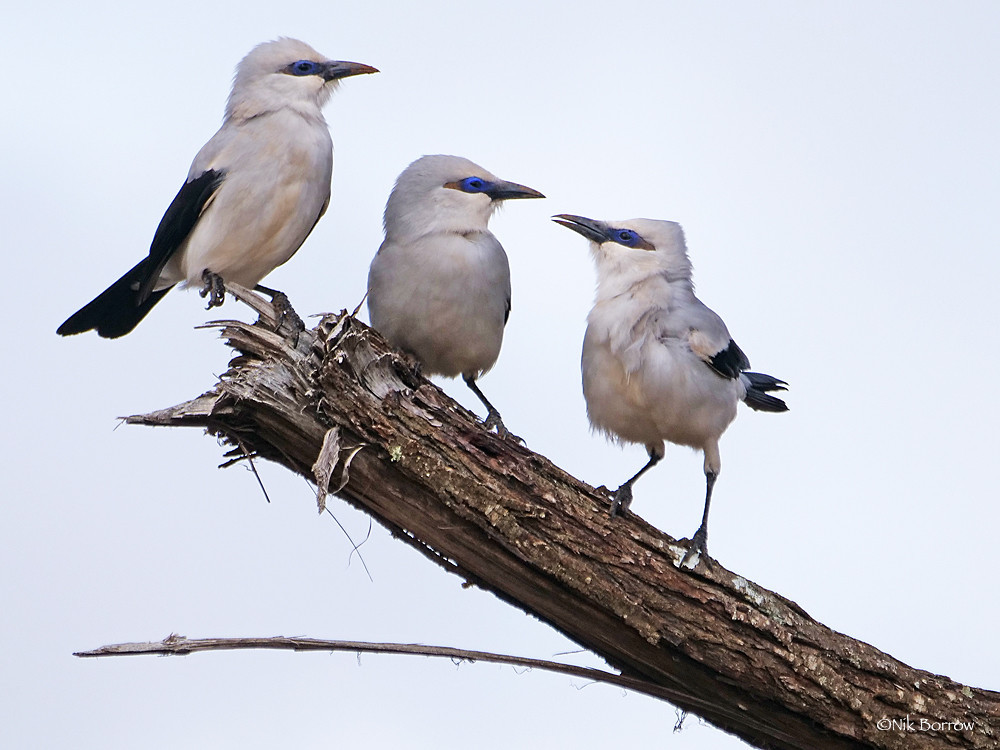
Stresemann’s bush-crows, Soda Plains, Ethiopia (photo by Nik Borrow, Creative Commons license on Flickr)

Seven years ago I wrote about an endangered member of the crow family in Ethiopia whose range is small and shrinking. Similar in size and sociability to our Florida scrub-jay, Stresemann’s bush-crow (Zavattariornis stresemanni or Ethiopian bush-crow) lives in just 6,000 square miles of southern Ethiopia’s Borana rangelands in an area smaller than New Jersey.

Has the bird’s status changed in the last seven years? No, but we know more.

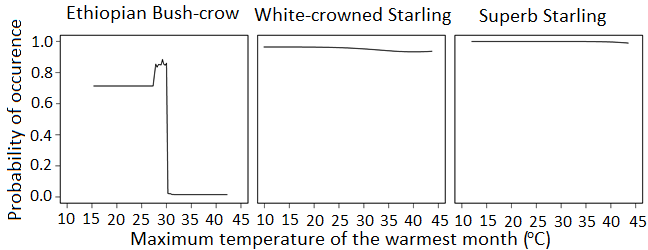
A 2012 study found that his range was limited by daily high temperature. In 2018 a team of scientists investigated further, taking temperatures throughout the region and comparing the bush-crow’s range to two other local species — white-crowned and superb starlings. Their report at the British Ornithological Union blog showed that Stresemann’s bush-crow has a narrow favorite temperature range and is heat intolerant.

The starlings don’t care how hot it gets but the bush-crow won’t live where the maximum daily temperature is over 30 degrees C (86 degrees F). (Graphs embedded below from bou.org)

Figure 3 embedded from BOU.org study in 2018 on Ethiopian bush-crow

This wouldn’t be a problem except that it’s getting hotter.

Find out more about the bush-crow’s dilemma at:

(photo of Stresemann’s bush-crow by Nik Borrow via Flickr Creative Commons license, Figure 3 embedded from BOU.org: High temperatures and hot birds; click on the captions to see the originals)

Tarballs in the Himalayas

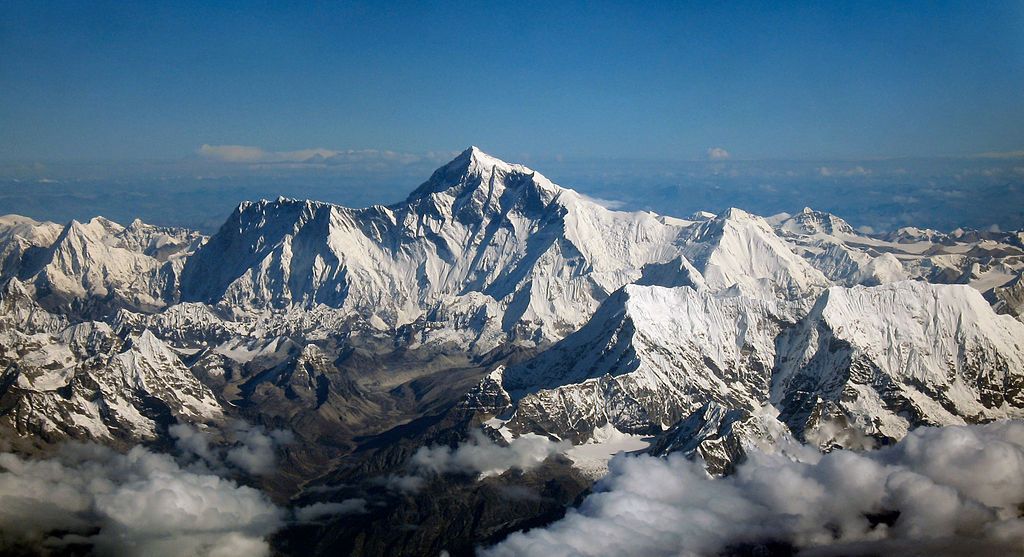
Mt Everest, Himalayas (photo from Wikimedia Commons)

9 December 2020

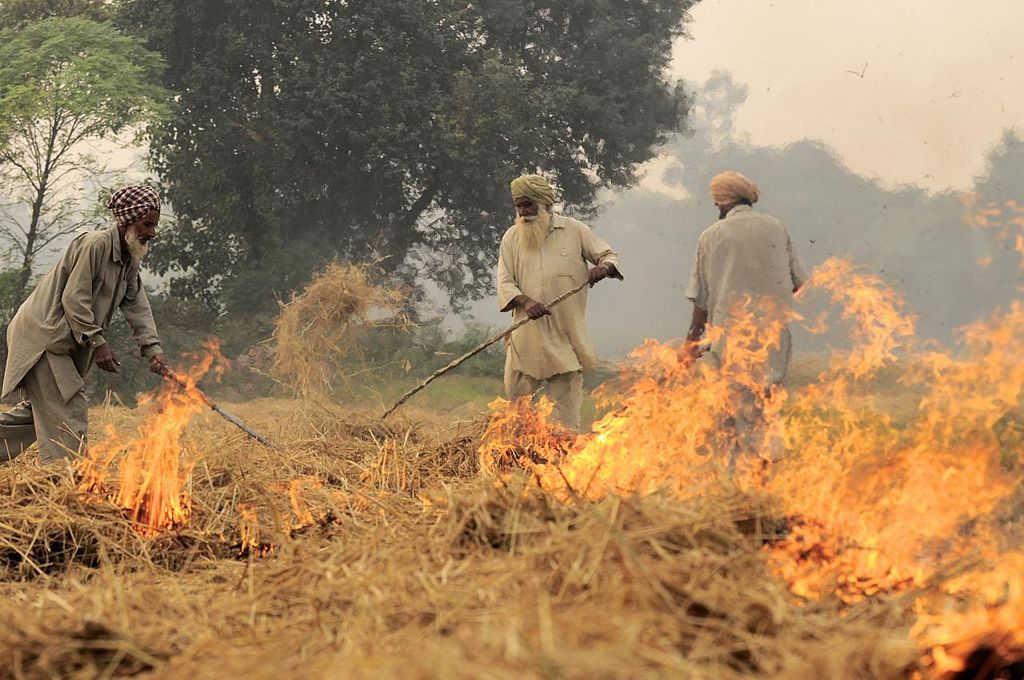
Every November air pollution spikes in India as farmers in the Punjab burn their fields in preparation for the next crop. Because the practice causes terrible air pollution it was outlawed in 2015, but small farmers cannot afford to buy the machines needed to clear the fields so the practice continues year after year.

Burning stubble to clear the fields, Nov 2011, Punjab, India (photo from Wikimedia Commons)

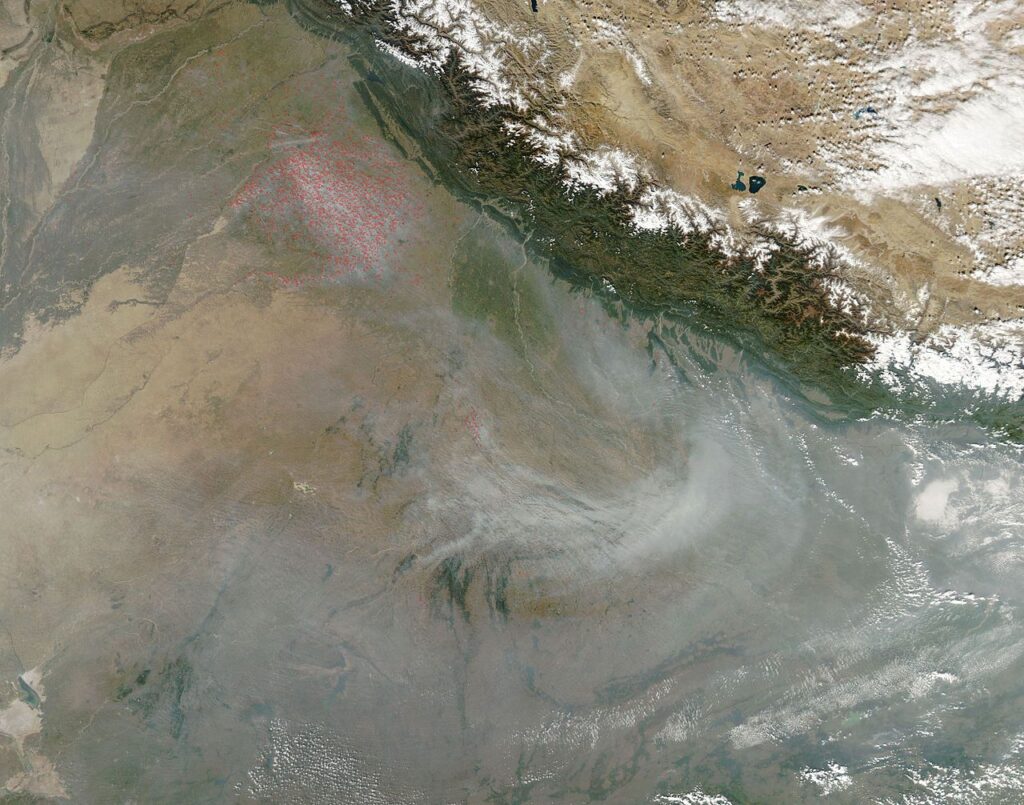
When the stubble burns Delhi is smothered in dangerous air pollution. The smoke from thousands of fires swirls high in the atmosphere and can be seen from satellites.

Smoke from agricultural fires (red dots) swirls toward the Himalayas, Nov 2013, NASA MODIS satellite (photo from Wikimedia Commons)

Meanwhile glaciers in the Himalayas have been retreating for the past decade. Scientists wondered if atmospheric carbon air pollution, landing on the white ice, was a factor in their warming. A team led by Yuan Q placed air pollution monitors in remote locations on the northern side of the Himalayas. Their report, published by the American Chemical Society on 4 November 2020, found an amazing thing:

Using electron microscopy, the researchers unexpectedly found that about 28% of the thousands of particles in the air samples from the Himalayan research station were tarballs, and the percentage increased on days with elevated levels of pollution. 

ACS.org: Brown carbon ‘tarballs’ detected in Himalayan atmosphere , 4 Nov 2020

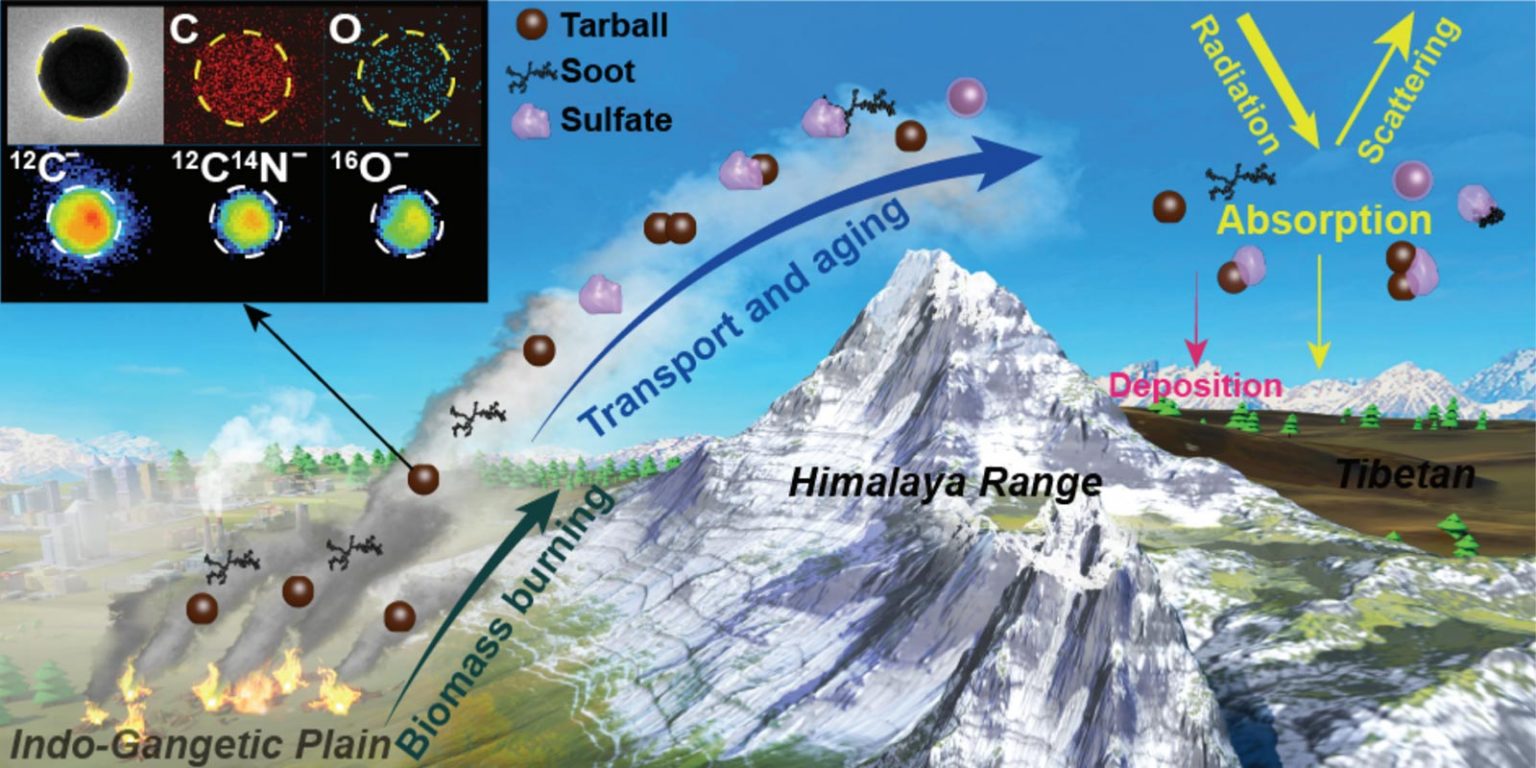
Microscopic tarballs form from brown carbon in the smoke of organic fires — in this case, stubble burning. They are so lightweight that they travel far, rising over the Himalayas to deposit on the other side. Their dark color absorbs sunlight and causes the glaciers to melt faster.

How smoke transforms to brown carbon tarballs in the Himalayas (CREDIT: ACS / Environmental Science & Technology Letters, graphic embedded from SciTechDaily news)

Stubble burning is a persistent annual problem in India as shown in the 2018 video from France 24 below.

Dec 2018: Crop burning crisis: India chokes as farmers set fields on fire, France 24 News

As India’s government provides community-shared machines for clearing stubble, the burning will come to an end. Will it be soon enough for the glaciers? Probably not.

Read more in this 4 Nov 2020 press release from ACS.org: Brown carbon ‘tarballs’ detected in Himalayan atmosphere

(photos from Wikimedia Commons, chart embedded from acs.org; click on the captions to see the originals)

The study is here: Yuan Q et al. Evidence for Large Amounts of Brown Carbonaceous Tarballs in the Himalayan Atmosphere. Environmental Science & Technology Letters. Published 4 November 2020. https://doi.org/10.1021/acs.estlett.0c00735

No Need To Huddle

Ducks in a huddle (photo from Wikimedia Commons)

11 November 2020

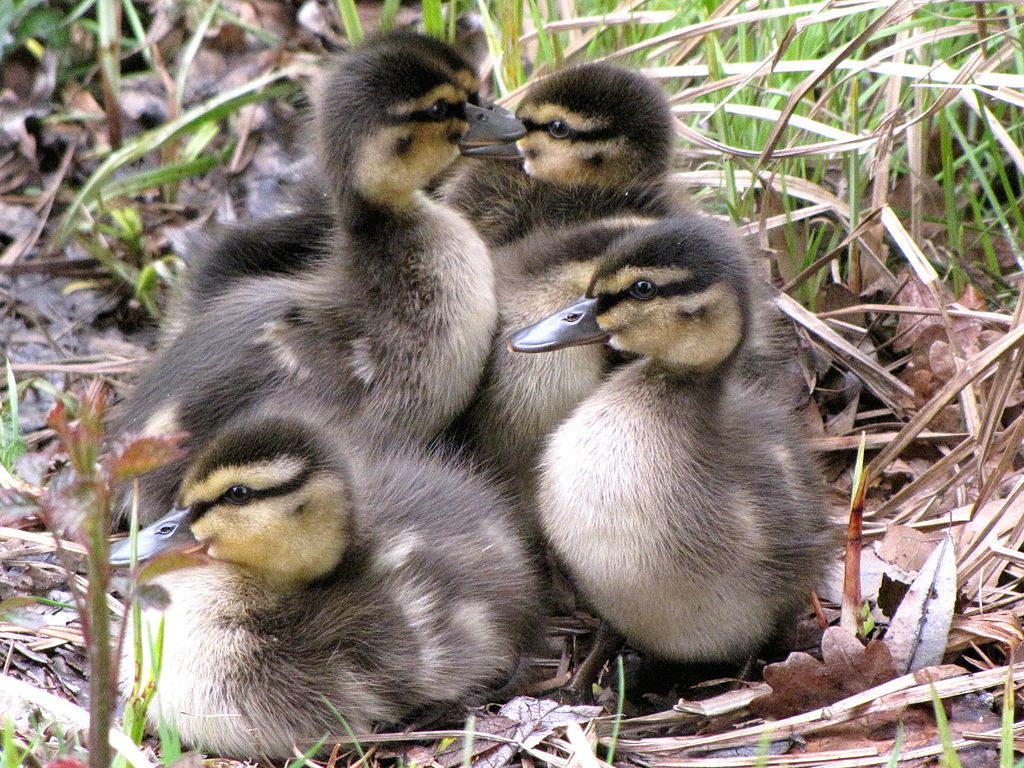
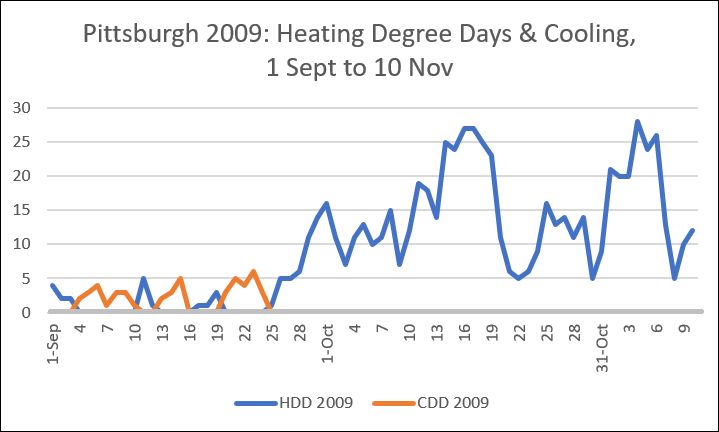
As temperatures soared this week from 9 to 19 degrees above normal, I remembered the time when our furnace broke in late September 2009. We thought we could tough it out while we waited for the new furnace to arrive but it was cold! The temperature went down on 25 September 2009 and never came up again. Like ducklings, we huddled inside to stay warm.

This graph shows how much we needed the furnace in the fall of 2009. The higher the blue line, the more we needed heat. We didn’t need air conditioning (orange line) after 25 Sept 2009.

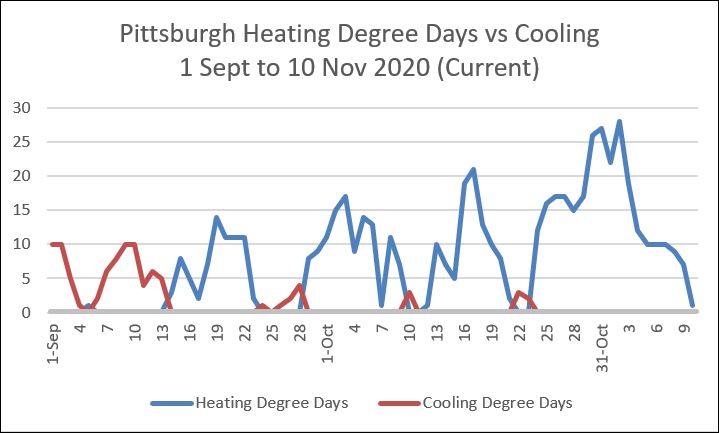
Not so this year! Every 10 days or so the temperature climbs so high that we’d benefit from air conditioning. Rather than flipping the thermostat from heat (blue line) to A/C (red line), I wear my summer clothes again. Climate change makes the temperature fluctuate widely.

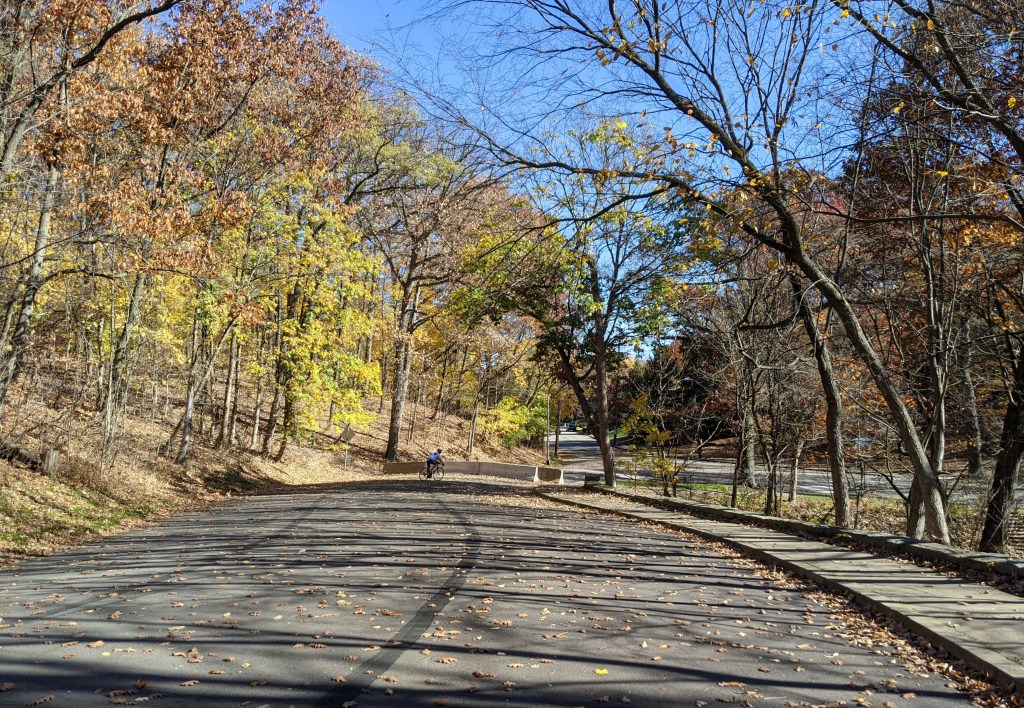
For five days this month it was summertime even though the trees couldn’t provide much shade.

Schenley Park’s Serpentine Drive, 10 Nov 2020 (photo by Kate St. John)

Today the weather will turn cold. The furnace is ready. No need to huddle this year.

p.s. Read about our no-furnace adventure in this vintage article: Huddle!

(photos from Wikimedia Commons and by Kate St. John)

Hurricanes and Smoke

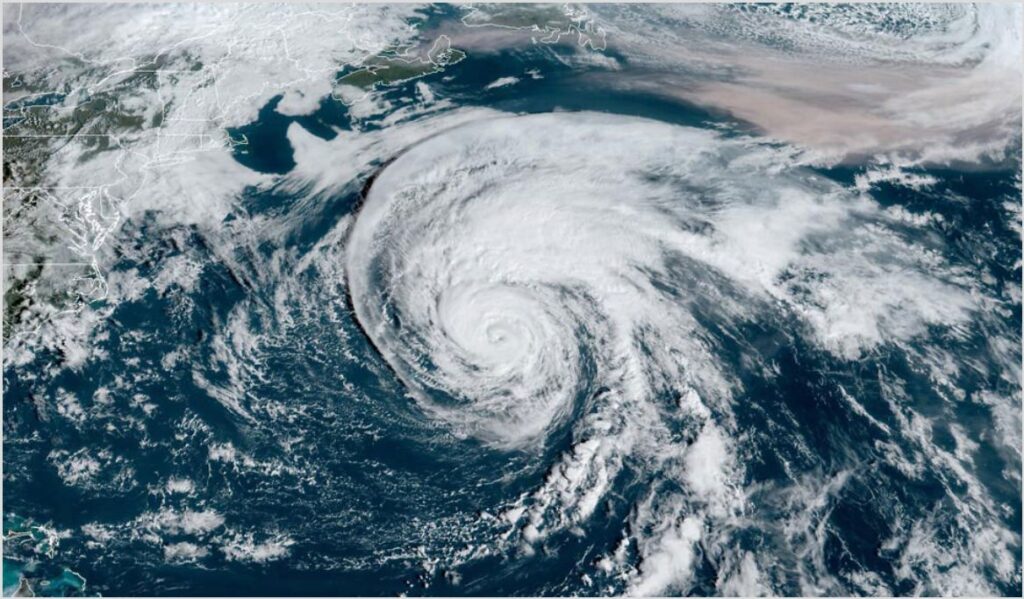
23 October 2020, 9:10a: Satellite shows Hurricane Epsilon near Bermuda and smoke from Colorado’s East Troublesome Wildfire crossing the Atlantic (image from GOES East, crop+description from Yale Climate Connections)

2020 has been a prolific year for heat, fires and hurricanes.

Last month was the hottest September on record, dangerous western wildfires have been burning since late July, and the Atlantic has had so many storms that the National Hurricane Center ran out of English alphabet letters and began naming storms using the Greek alphabet.

On Friday, 23 October 2020, Yale Climate Connections reported that a weather disturbance in the Caribbean is likely to become the sixth Greek alphabet storm, Zeta. That’s number 32. In the report they included an intriguing GOES EAST satellite image, above, with this explanation.

Smoke from Colorado’s second largest fire on record, the 170,000-acre East Troublesome Fire, was carried by the jet stream to the northeast of Hurricane Epsilon (upper right of image).

Yale Climate Connections: Disturbance in the western Caribbean likely to become Tropical Storm Zeta

As this moment Colorado’s East Troublesome Wildfire is burning through Rocky Mountain National Park and threatening Estes Park (click here for video). I’m not surprised the smoke showed up near a hurricane.

See more reports at Yale Climate Connections:

(image from GOES East cropped by Yale Climate Connections)