Pittsburgh will be warmer this winter because the Pacific Ocean’s “skin” is colder than usual at the equator. This ocean change is called La Niña.
During a period of La Niña, the sea surface temperature across the equatorial Eastern Central Pacific Ocean will be lower than normal by 3 to 5 °C (5.4 to 9 °F). It persists for at least five months.
— definition of La Niña, Wikipedia
Here’s what the sea surface temperature looks like in this anomaly map from November 2007. Blue is colder than normal, orange is warmer.
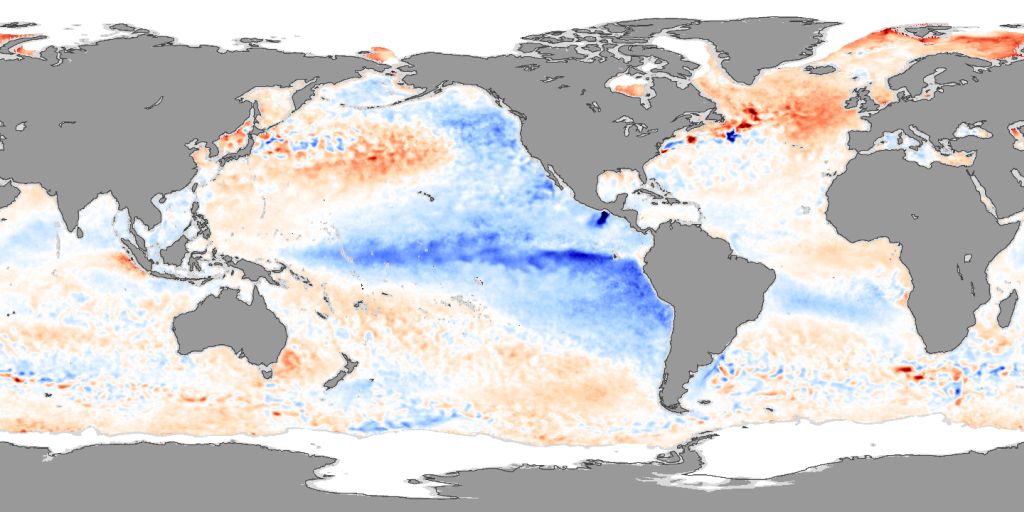
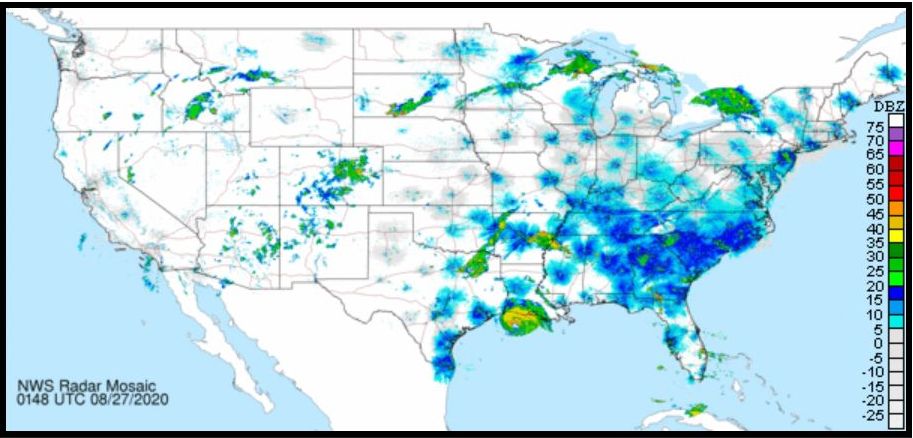
La Niña affects weather worldwide, causing “more rain than average through Indonesia, drier weather in southeastern China” and a variety of colder/warmer and wetter/drier effects in North America as shown on the map at top.
Pittsburgh will be affected but it won’t be extreme.
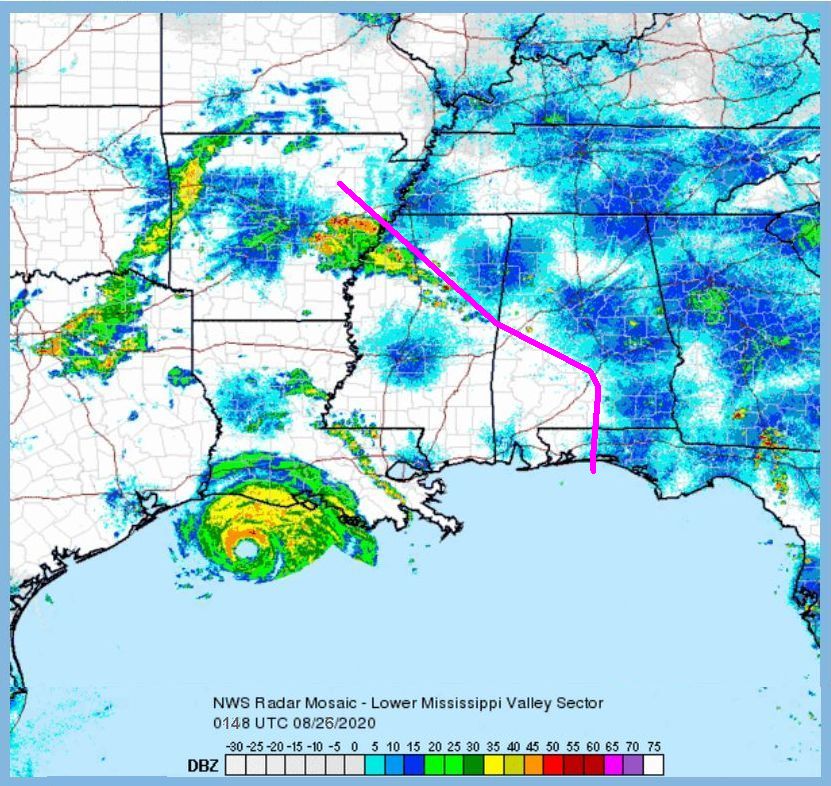
Check out these December-January-February 2020-21 predictions for the continental U.S.
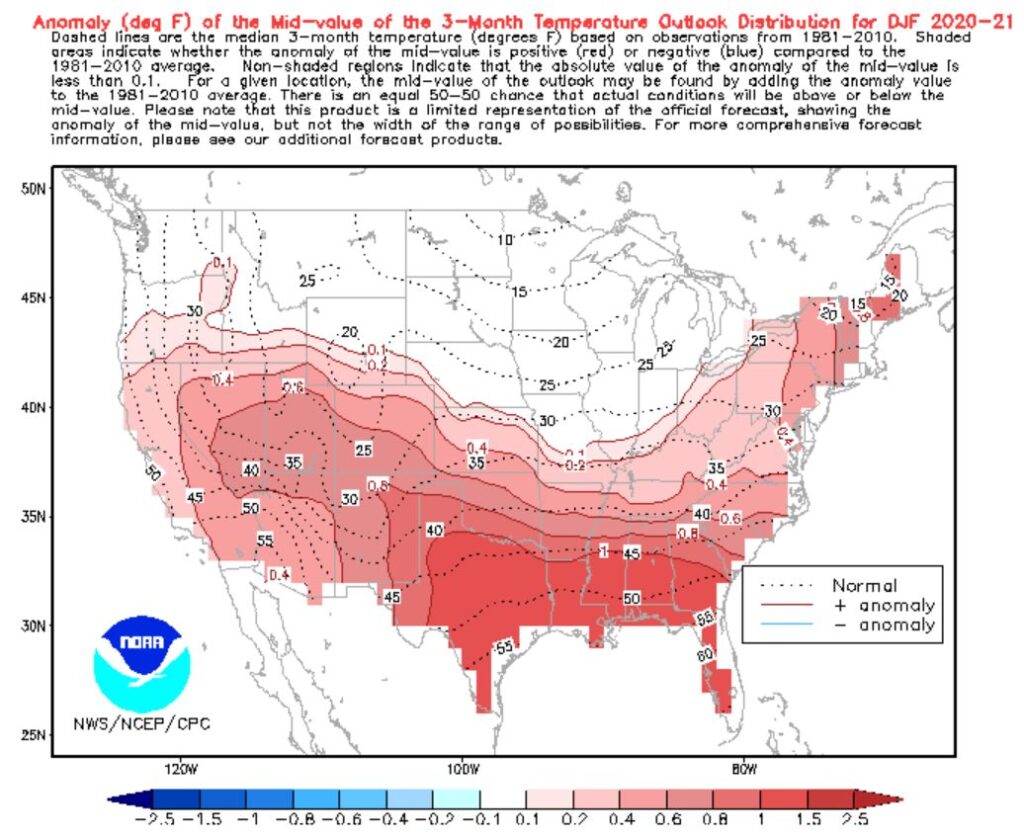
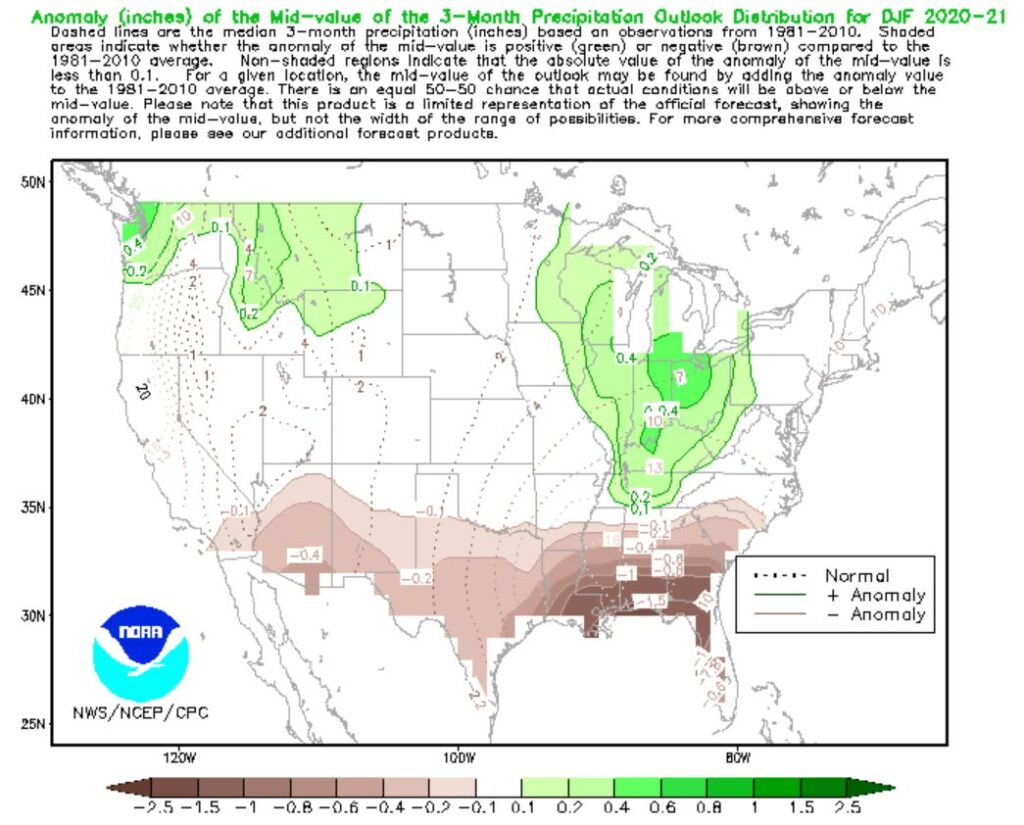
The Gulf Coast is really going to feel it!
(maps from NOAA and National Weather Service. Click on the captions to see the originals)