Tiny snowman at Gilfillan Park, 2 Jan 2020 (photo by Kate St. John)
Pittsburgh is not alone in feeling the heat. Here’s today’s temperature forecast for the continental U.S. It looks like a Polar Vortex doesn’t it? High winds are on the way!
For temperature, the redder the color the more likely it will be hotter than normal. For precipitation, green means it’s likely to be wetter. Pittsburgh is high in both categories, hot and wet. So is Alaska, especially in temperature.
At the end of The Inferno, set in the year 1300, Dante and his guide Virgil escape from Hell climbing upward to reach the Earth. They’ve almost emerged when Dante looks through the opening ahead and sees the heavens above.
… we climbed up, he first and I behind him, far enough to see, through a round opening, a few of those fair things the heavens bear. Then we came forth, to see again the stars.
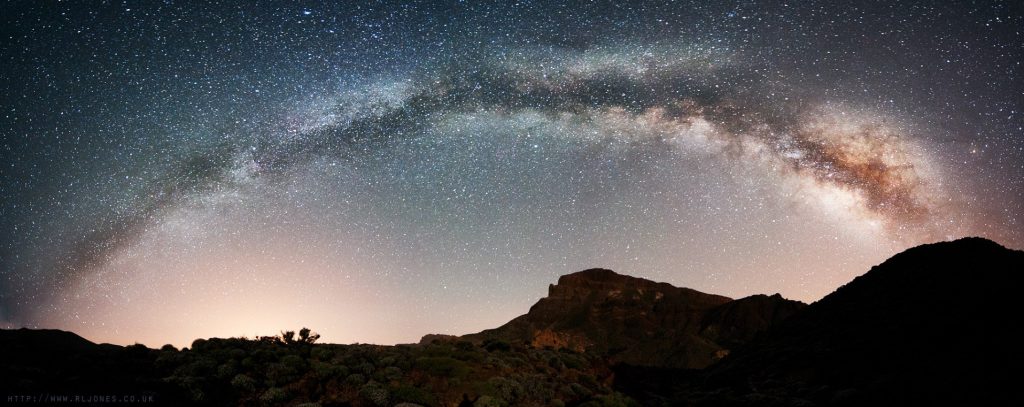
The heavens are still wondrous but most of us miss it. So much electric light floods the sky that we cannot see the stars. No Milky Way (above), no meteor showers (below).
To see the stars as Dante saw them we have to visit remote locations where the sky is dark. Click on the Milky Way photo at Tenerife (top) to see the sky in full screen splendor.
“Then we came forth, to see again the stars.”
p.s. This week we learned of an unexpected threat to viewing the stars: Thousands of tiny new satellites, launched by Elon Musk’s SpaceX, will obscure and confuse the astronomers’ view.
p.p.s. Stelle, meaning stars, is literally the last word in each of the three cantiche of Dante’s Divine Comedy: Inferno, Purgatorio and Paradiso.
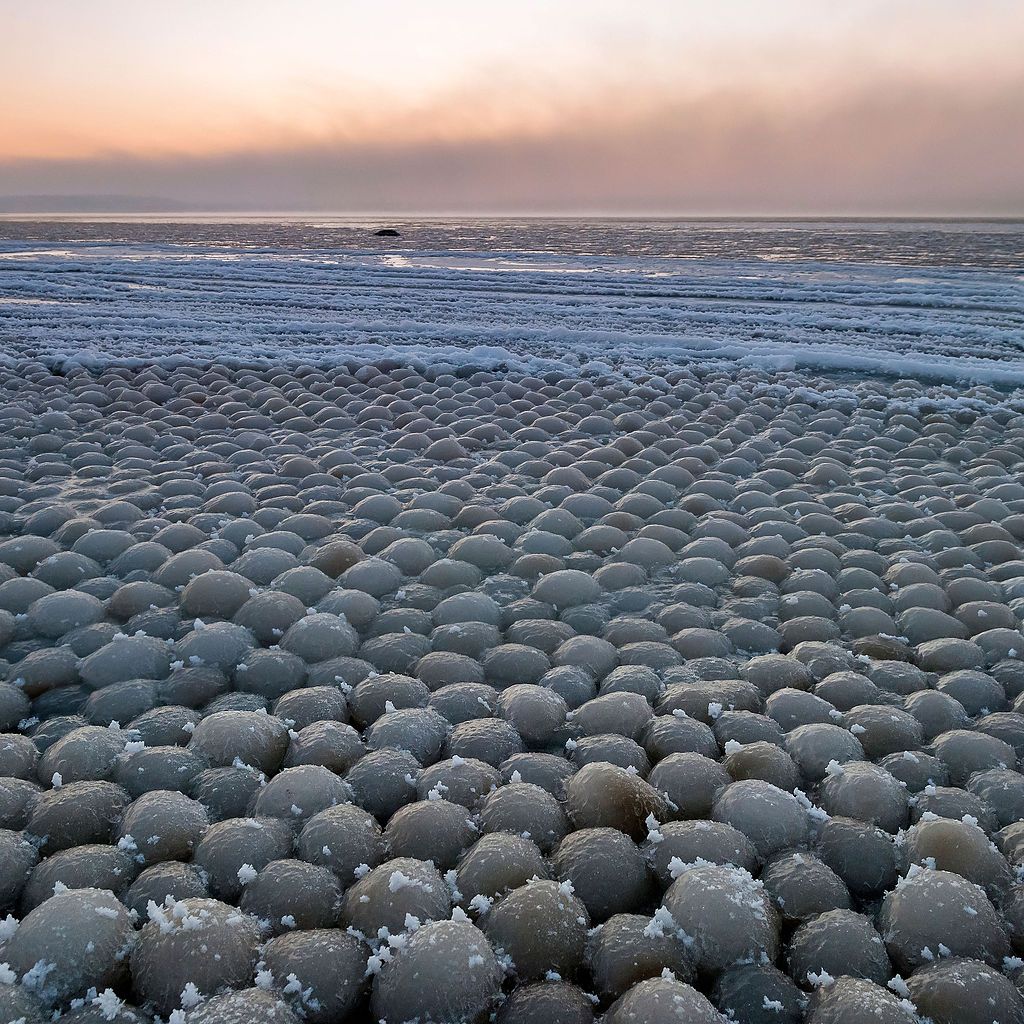
On rare occasions, winter weather and the sea conspire to make ice balls that stack on the beach when they roll ashore. This ball ice, about the size of softballs, covered Stroomi Beach at the Baltic Sea in Estonia in December 2014.
Ball ice is so rare that it made the news last month in Alaska and Finland. Similar to hail, it forms in bays where the water is relatively calm and just cold enough to make ice. A “seed” of ice or grit starts the process, then wind and gentle waves keep turning the floating ball as it grows.
Sometimes two cool things happen at once. In this tweet from NWS APRFC, a field of ice balls in Alaska acquired pointy hats when snow or rime accumulated on one side.
Interesting formation of ice on the banks of the Wulik River near Kivalina. We suspect a combination of strong waves and super cold water created these ice balls. pic.twitter.com/oIM19Jle2N
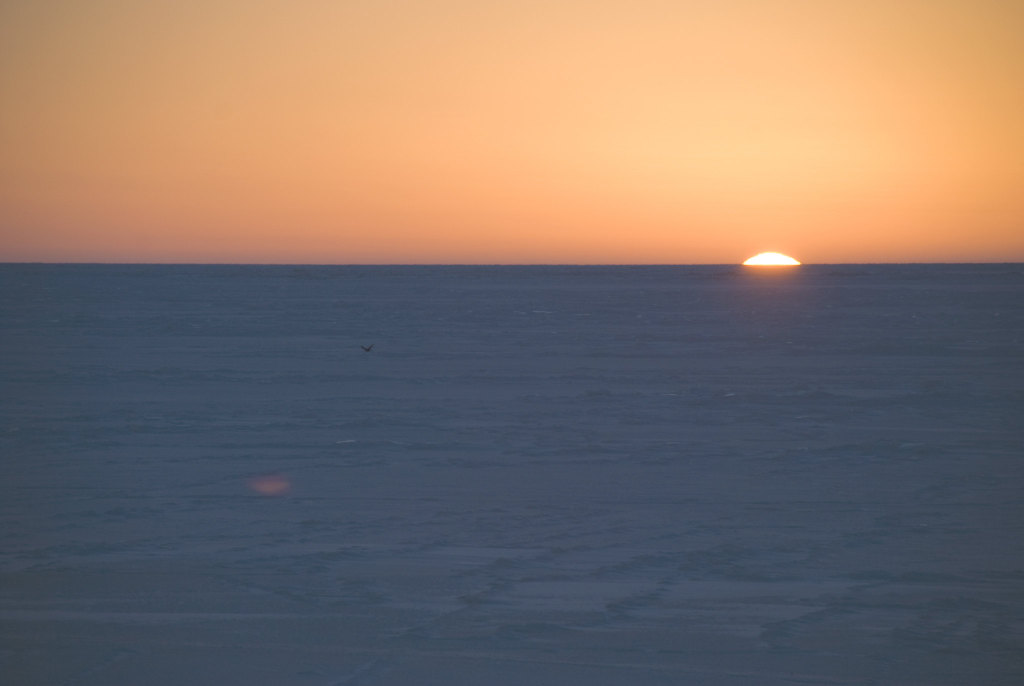
Today the sun will pause at 11:19pm Eastern Time and begin to move north again — or so it will seem to us earthbound humans.
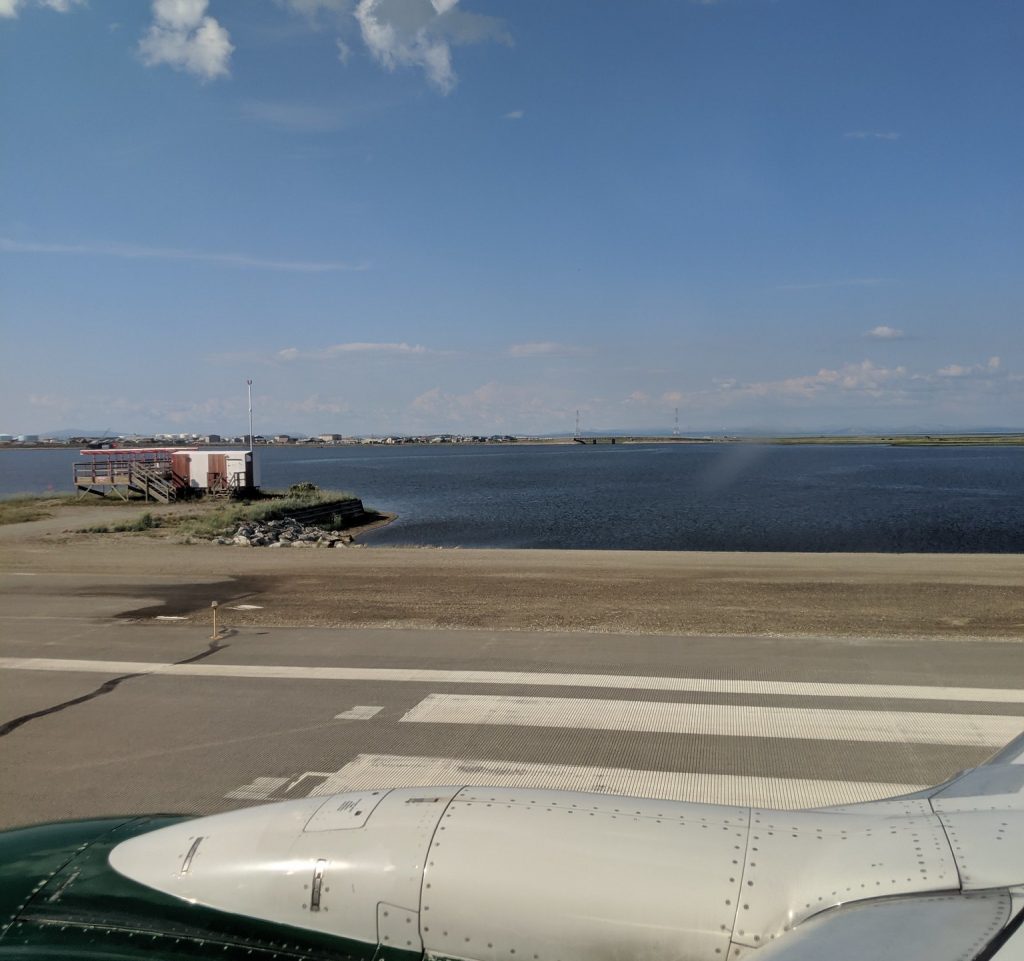
The far north will be dark but not inky black everywhere. At Kotzebue, Alaska, 26 miles north of the Arctic Circle, the sun will rise at 12:56pm and set 1 hour and 43 minutes later, similar to the solstice photo above, taken at Bering Land Bridge NP. Kotzebue is the furthest north I’ve ever been though I didn’t get off the plane..
Scene from the plane at Kotzebue, Alaska on the day before the summer solstice, 2019 (photo by Kate St. John)
Here in the Lower 48 we’ll have lingering sunsets …
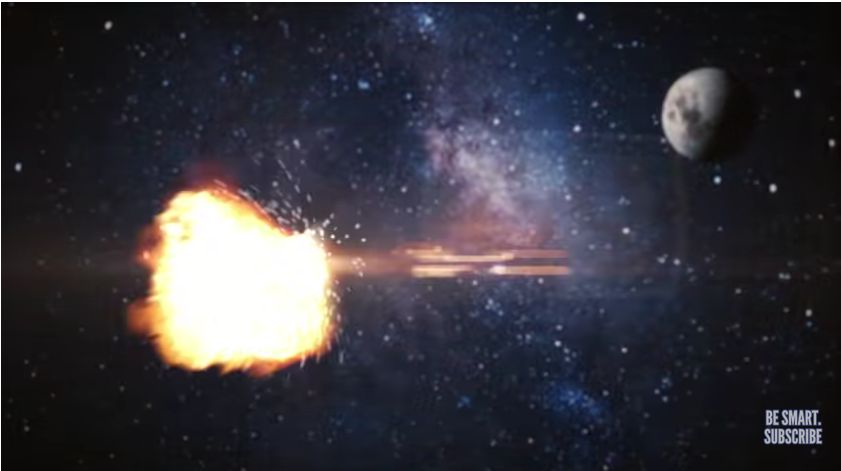
Since 1957 when the Space Age began, our unused equipment has created a garbage patch in outer space. Over the years we’ve launched 5,000+ satellites though only 1,300 are operational today. There’s a lot of junk up there that’s out of control (can’t be navigated anymore) and potentially explosive.
Even if it can’t explode, space junk is dangerous to active satellites because it travels so fast. In Low Earth Orbit, where the International Space Station lives, everything travels at 17,500 miles per hour (28,000 km/hour). A crash at that speed, even with a tiny object, can destroy a satellite. When a satellite dies something electronic fails here on Earth.
Meanwhile we’re launching more satellites every year at a faster pace than before. At the end of 2018 it had taken a decade to launch 1,000 CubeSat nano-satellites, only four-inches across, but there are plans to add 1,000 more by 2021. Outer space is so crowded that NASA and the European Space Agency (ESA) work every day to steer satellites away from dangerous space debris.
The 2016 video above describes space junk and how we’ve coped with it so far. Note that it doesn’t talk about CubeSats because the video predates those plans.
ESA’s 2017 video below describes the problem in technical terms with dramatic background music. I’ve cued the video to start at Low Earth Orbit. Watch for two minutes (beyond the first fade-to-black) and you’ll see lots of collisions.
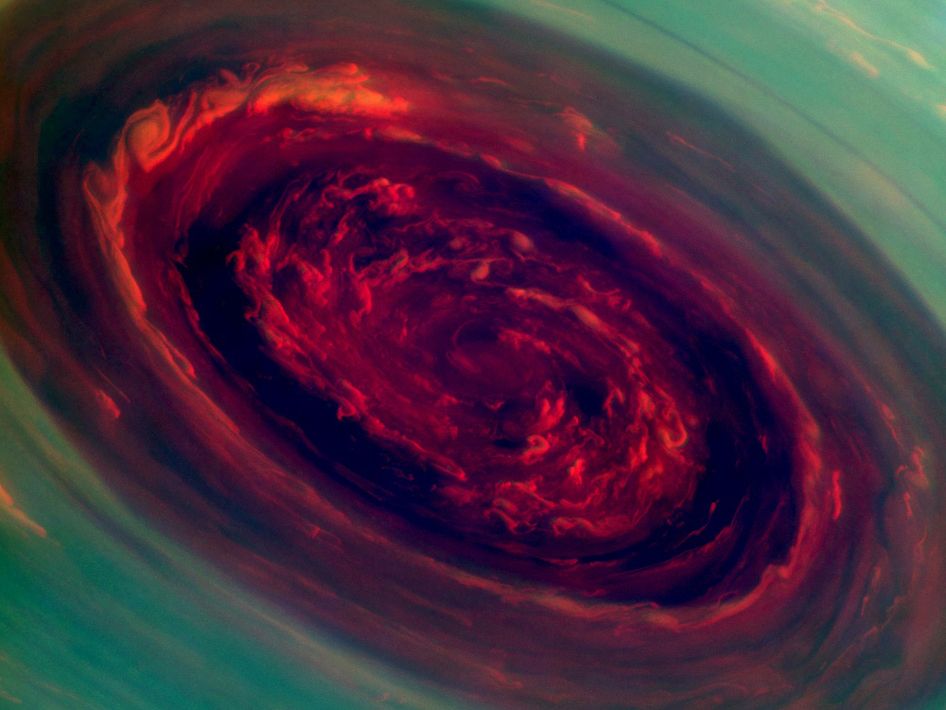
Our planet isn’t the only one that has these clouds. This photo of Saturn’s north polar vortex shows Kelvin-Helmholtz clouds on the spinning edge. Photographed by the Cassini spacecraft in April 2013 and colorized by NASA, this image is called The Rose but is actually a violent, relentless storm. And it’s big!
According to the Cassini Mission at NASA, “Measurements have sized the eye at a staggering 1,250 miles (2,000 kilometers) across with cloud speeds as fast as 330 miles per hour (150 meters per second).”
Our own polar vortex is mild by comparison.
(photo from NASA via Wikimedia Commons; click on the caption to see the original)
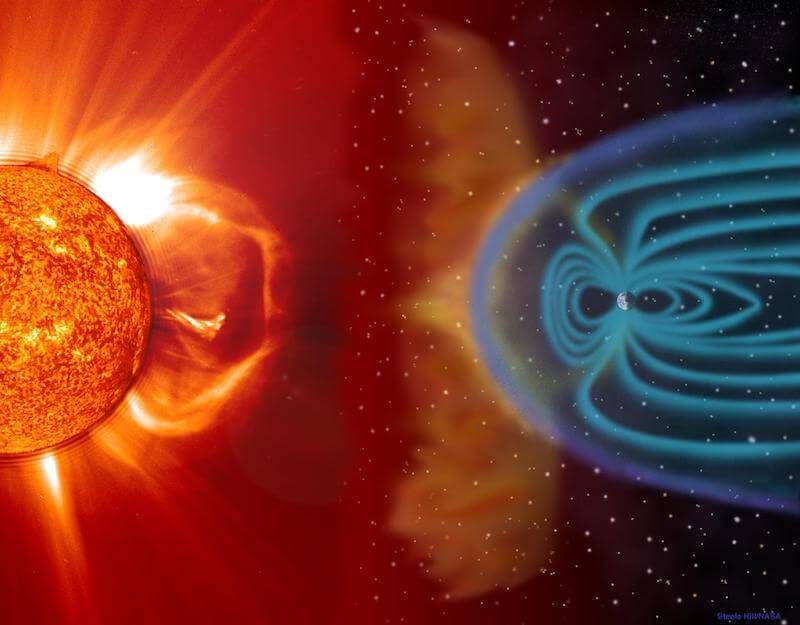
In other words, there’s a potential for mild auroras and minor electrical and magnetic disruptions this week because the solar wind (“high speed stream influence”) is going to blow hard past the Earth — but not so hard that it breaks things.
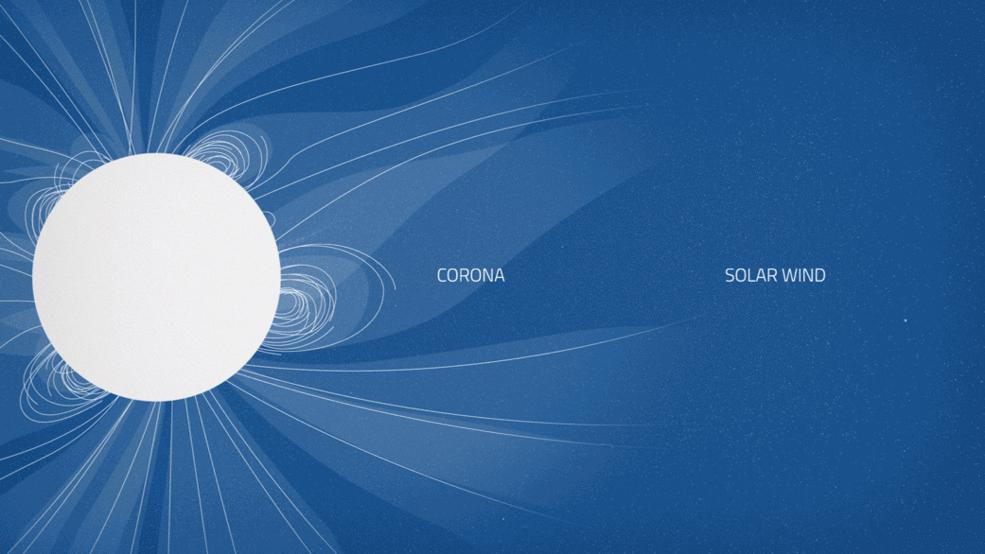
The solar wind originates from the Sun’s corona, the glowing atmosphere you see behind the moon during solar eclipses. Because the corona is fluid, it develops thin spots called coronal holes that emit the Sun’s magnetic field and charged particles. Usually the particles loop out and back into the Sun (animation below) but those that don’t return come roaring off the Sun in a solar wind that travels as fast as 500 miles/second.
The Earth’s magnetic field shields us from the solar wind but its force distorts the shield (shown in blue below). Sometimes electromagnetic particles seep into our atmosphere and cause geomagnetic storms known as space weather.
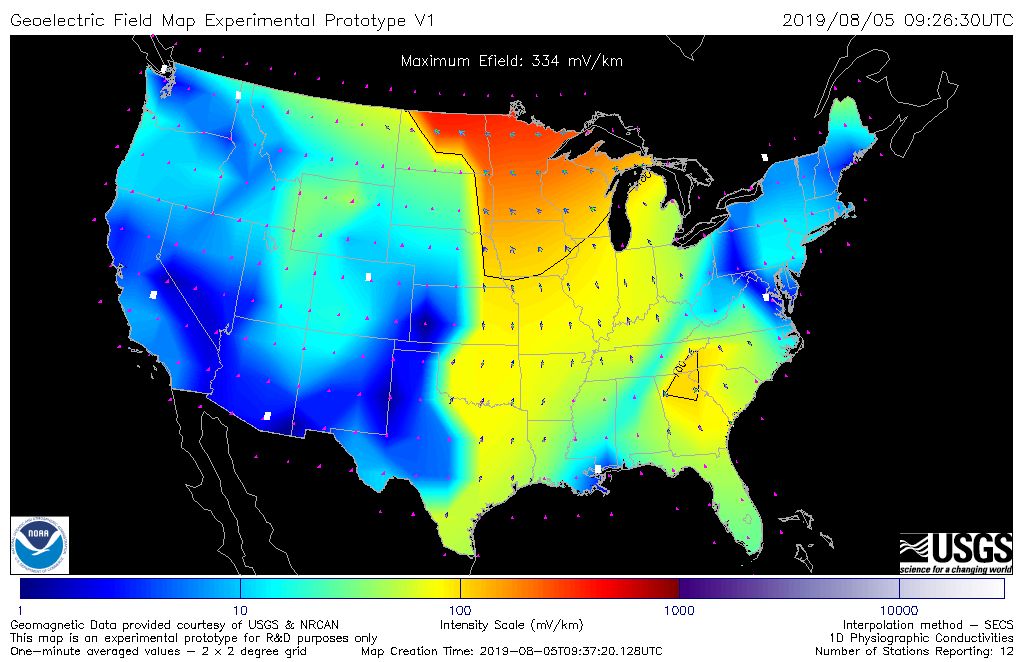
Space weather messes with electronics on our satellites and increases their orbital drag. Really bad space weather — from solar flares and coronal mass ejections — disrupts our electric grid, our high frequency radio communications, and the accuracy of GPS navigation.
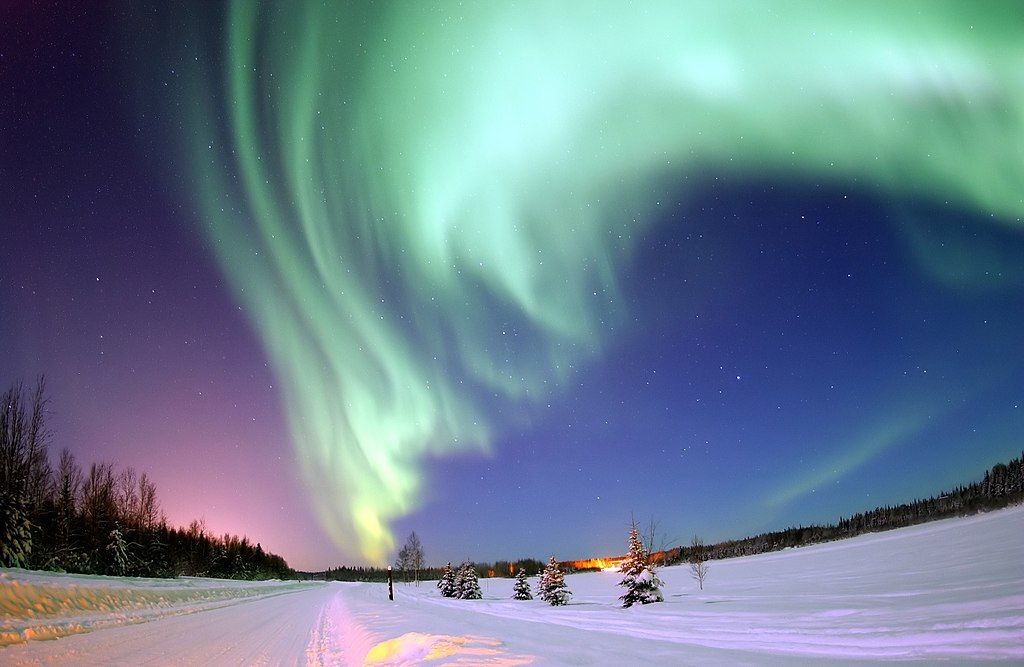
Space weather causes trouble but it has one very beautiful effect. When the particles follow Earth’s magnetic field lines down to the poles they create auroras that are visible during winter darkness. Here’s a stunning one at Bear Lake, Alaska in 2005.
Fortunately this week’s space weather will be very minor, but so will the accompanying aurora. The northern lights won’t be intense nor will they be visible in the Lower 48 states.
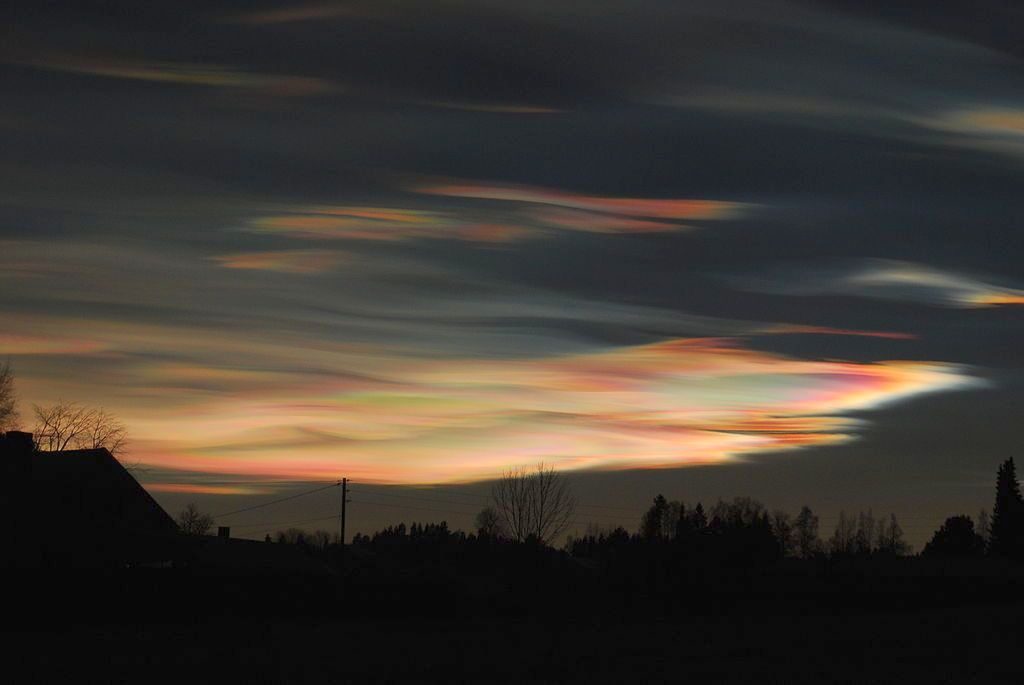
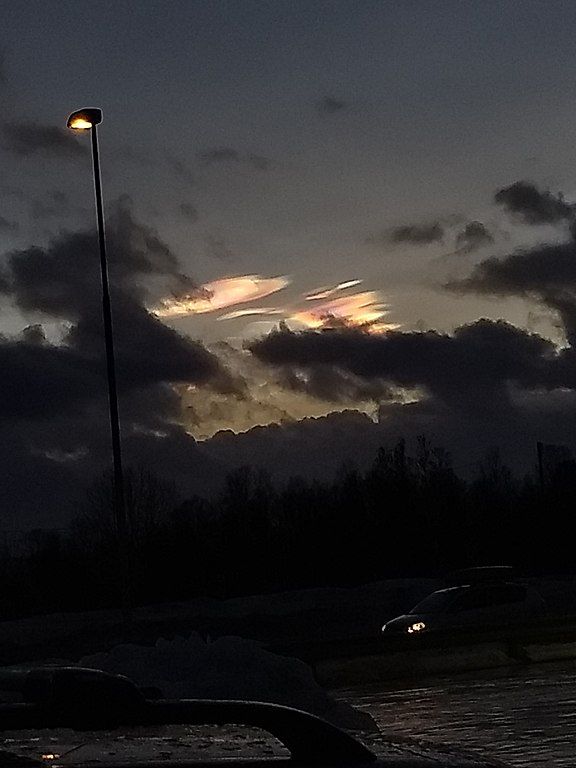
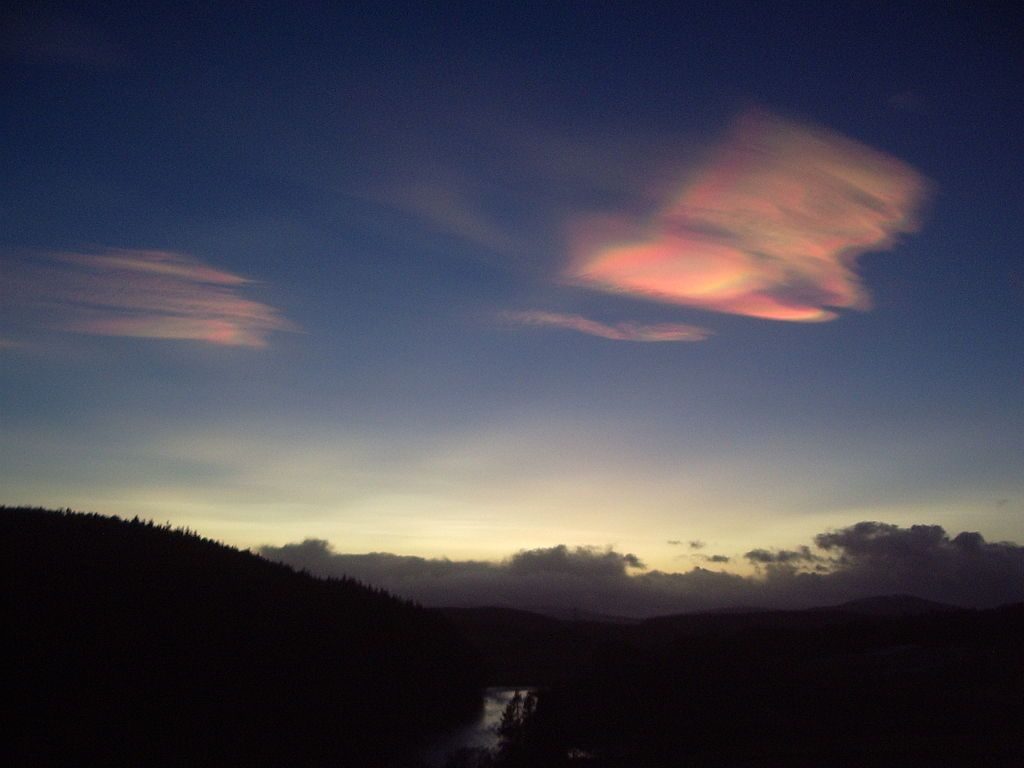
Near the poles in winter there are sometimes pearly-looking clouds glowing high above the Earth.
Polar stratospheric clouds (PSCs), also called nacreous clouds for their pearly appearance, form in the lower stratosphere at 49,000 to 82,000 feet — 1.5 to 2.6 times higher than a jet. They’re a winter phenomenon because they only form in the presence of super low temperatures, minus 108oF and colder.
Here you can see that they’re high above our usual clouds.
Nacreous clouds can cause trouble. Those made of water are benign but some are made of nitric acid + water that reacts with ozone in the stratosphere and creates a hole in the ozone layer. Stratospheric ozone protects Earth from the sun’s ultraviolet rays. It’s bad to have a hole in it!
Though we’ll never see these pearly clouds in Pittsburgh, we can appreciate their beauty from afar.
p.s. The irony of ozone: Ground level ozone is bad; it burns plants and our lungs. Stratospheric ozone is good; it protects us from ultraviolet light. Ozone’s value depends on where it is.