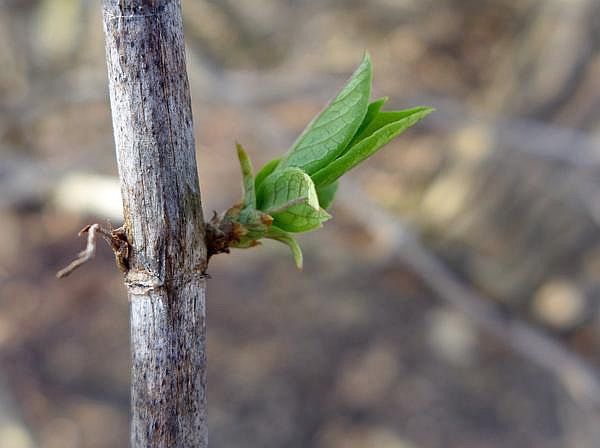
Honeysuckle leaves open in the heat, 20 Feb 2018 (photo by Kate St. John)
21 Feb 2018
Yesterday we put on our summer clothes and this honeysuckle bush put out new leaves. It was summer in February.
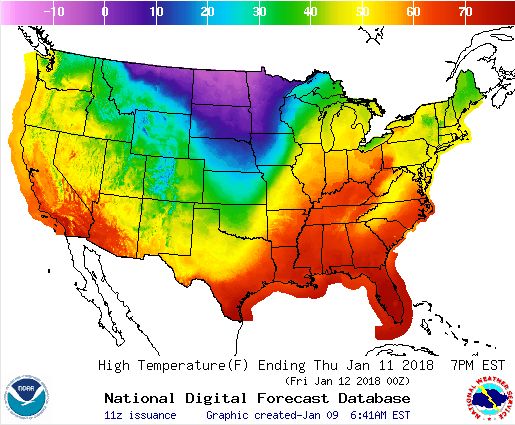
At 78 degrees F the high temperature broke two Pittsburgh records: a new high for February 20 (formerly 68 degrees in 1891) and a new high for the entire month of February. It was 37 degrees above normal.
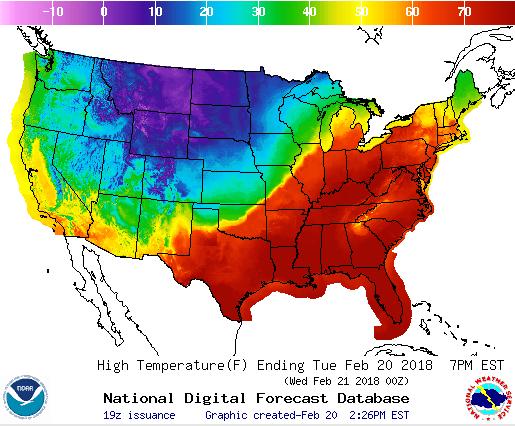
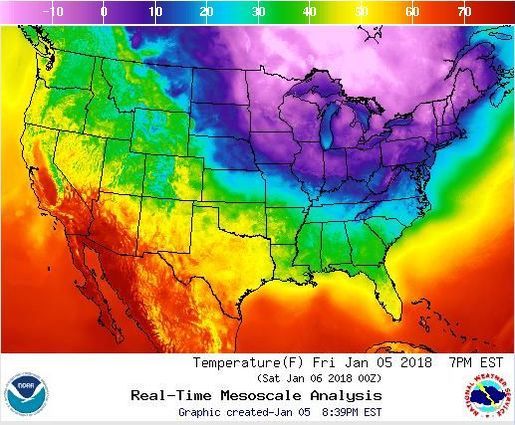
When you look at yesterday’s map you can see how it happened. The jet stream dipped across the Northern Rockies and Plains, then abruptly turned north over the Texas Panhandle. It was only 3 degrees F in western Nebraska while we were nearly 80. The narrow temperature gradient — that yellow line across the Midwest — continues to produce heavy rain.
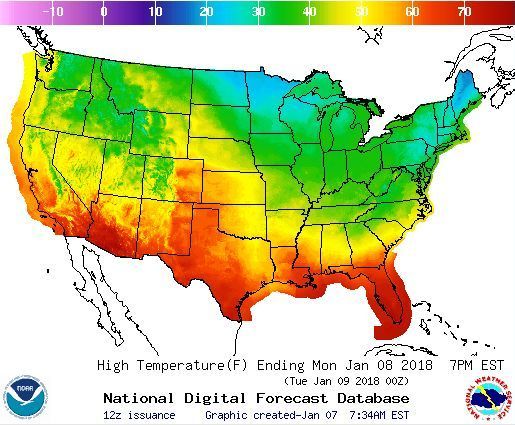
U.S. high temperature forecast for 20 Feb 2018 (map from the National Weather Service)
Meanwhile, like a yo-yo, we’re headed back to normal tomorrow and will lose those 37 degrees. Today’s our last chance for record heat.
(photo by Kate St.John. Temperature map from the National Weather Service; click on the image to see the latest map)
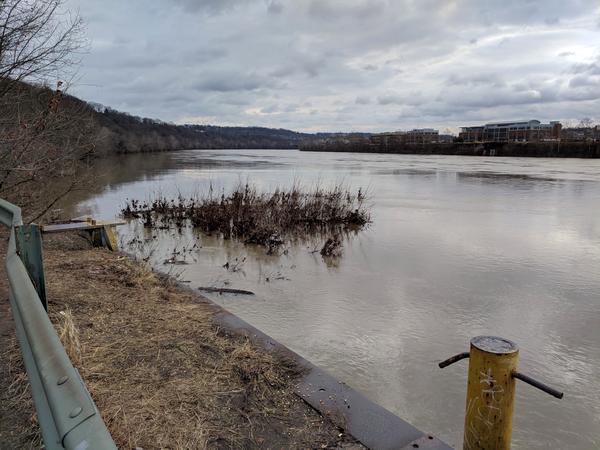
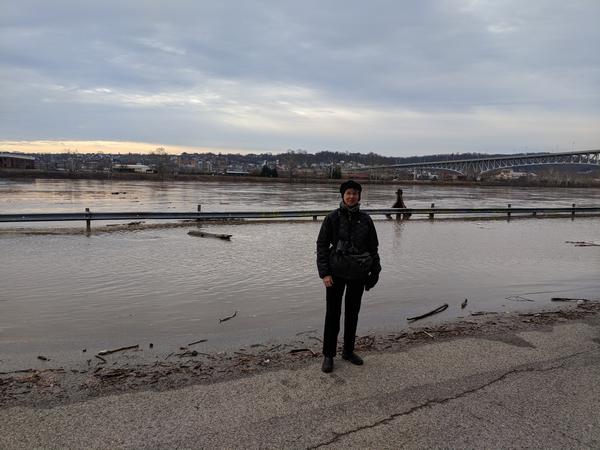
Moderately high water on the Monongahela River at Duck Hollow, Thursday 15 Feb 2018, 9:30am (photo by Kate St. John)
SCROLL DOWN TO SEE UPDATES.
This week in the space of 40 hours — Feb 14, 4:30pm to Feb 16, 9:50am — the Pittsburgh region received 2.5+ inches of rain. At first it flooded creeks and streams. Now it’s in the Allegheny, Monongahela and Ohio Rivers.
Since I live near the Mon River I went down to Duck Hollow to see what it looked like. In video below from Friday morning 16 Feb, the island of treetops in Thursday’s photo had disappeared.
Today (Saturday) the rivers are even higher and I don’t have to visit them to find out. The PennDOT traffic cams tell the story.
In Downtown Pittsburgh there’s a stretch of I-376 westbound called “The Bathtub” that dips into the Mon River flood zone. Last month it was the site of exciting river rescues when two people drove their vehicles into it as the water was rising. Click here to see a Live Video of the rescues.
This morning The Bathtub is full, as shown in before-and-after photos from the PennDOT traffic cam: Yesterday (Feb 16) on the left, today (Feb 17) on the right, both at 7:20am.
PennDOT traffic cam at The Bathtub: Feb 16 2018 (before the flood) and Feb 17 (during)
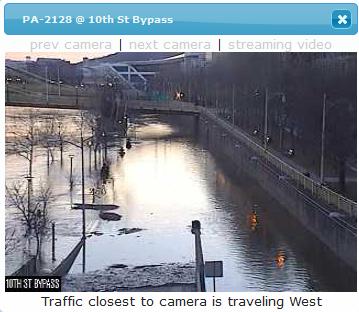
The Allegheny is flooding, too, at the 10th Street Bypass.
PennDOT traffic cam at the 10th Street Bypass, 17 Feb 2018, 7:20am
All of this is “Minor” flooding in Pittsburgh per the National Weather Service. (Flooding on the Youghiogheny River in Sutersville nearly reached the “Major” stage last night. It’s receding now.)
Later this morning I’ll go down to Duck Hollow and see what’s up. The water’s up for sure!
UPDATES: Saturday Feb 17 & Sunday Feb 18.
The Monongahela River crested around mid morning on Sat. February 17 and started to go down a little by noon. 17 Feb 2018, 9:30am: I saw small fish swimming in the parking lot! Two Canada geese float by beyond the guardrail.
No parking today!
At the edge of the Mon River at Duck Hollow, 17 Feb 2018, 9:30am
17 Feb 2018, 12:11pm: The water has started to recede, though not by much.
18 Feb 2018, 6:00am: The Bathtub on I-376 and the 10th Street Bypass are still closed due to flooding. The water is about 1/3 to 1/2 gone.
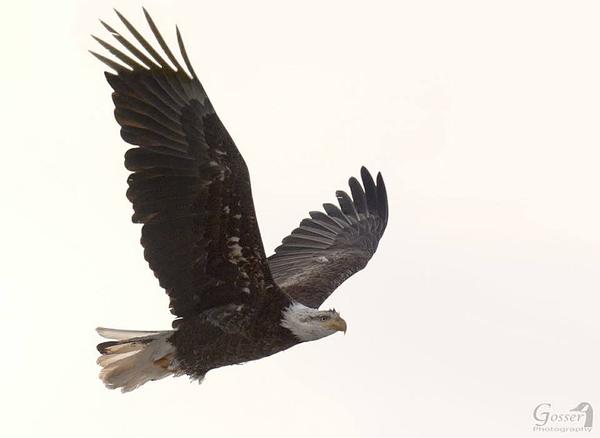
Bald eagle with ice on his forehead and belly, Crooked Creek, Jan 2018 (photo by Steve Gosser)
After a balmy Thursday and Friday the temperature is plummeting tonight to 5oF.
During the last deep freeze, Steve Gosser photographed a bald eagle at Crooked Creek with iced feathers on his belly and head. Notice how his head feathers are standing up as if he used hair gel!
The eagle’s ice shows the great insulation power of feathers and how extreme cold can form ice very quickly when the eagle lifts his head out of the water.
He’ll be getting another chance to wear icicles this weekend. Brrrrr!
Egads, it was cold last weekend! Here in Pittsburgh it was -6 to 11 degrees F, but yesterday things turned around. Sunday (7 Jan.) started at -6°F but warmed to a high of 30. Today will be above freezing and by Thursday the high will be 64°F. That’s a swing of 70 degrees in only four days!
The slideshow above shows this in color for January 5, 8, 11 and 12.
I’m not complaining that we’re out of the deep freeze but … this weather is really odd. Why did it get so cold and why is it warming so fast? Why don’t we have a moderate winter like we used to?
Crazy as it sounds, it’s because the arctic is warming faster than the rest of us. When there’s not a big temperature difference between the North Pole and the mid-latitudes (us) the jetstream slows down. When it’s sluggish, it wobbles in high amplitude loops that dip as far south as Florida(*).
The video below explains why. I recommend watching it twice; you see more the second time. (My end notes have info on millibars, etc.)
So when a cold loop settles over us, we’re really cold and when it moves on we’re really hot. It happens quickly in both directions.
Don’t put away your winter clothes on Thursday. The forecast says it’ll be 5 degrees on Saturday night.
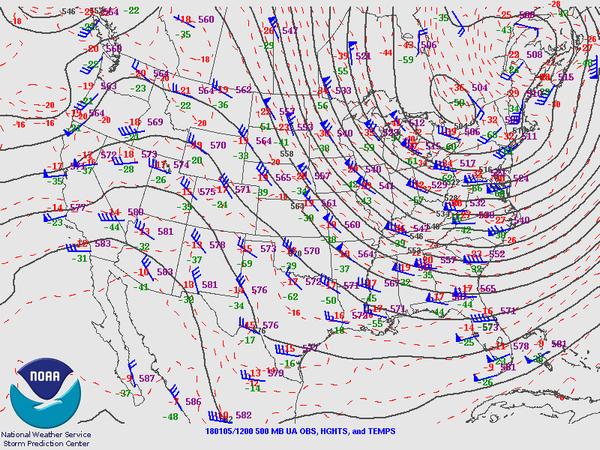
The average air pressure at sea level is 1013.25 millibars = 14.7 pounds.
What’s the significance of 500 millibars? The 500 millibar pressure zone is where air pressure is half what it was at sea level, halfway up in the atmosphere. Since air pressure varies as weather systems move above us, the 500mb map is a great diagram of what the weather systems are doing. Here’s the air pressure map for Friday 5 Jan 2018 at 1200z (8am). Notice that the pressure lines echo Friday’s temperature map above.
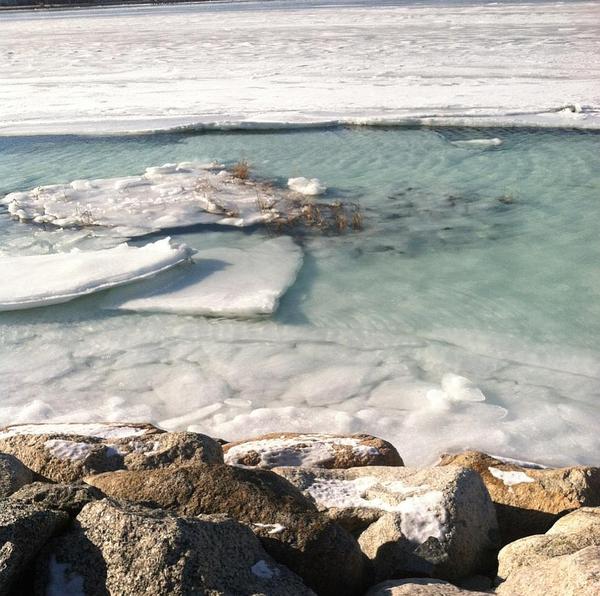
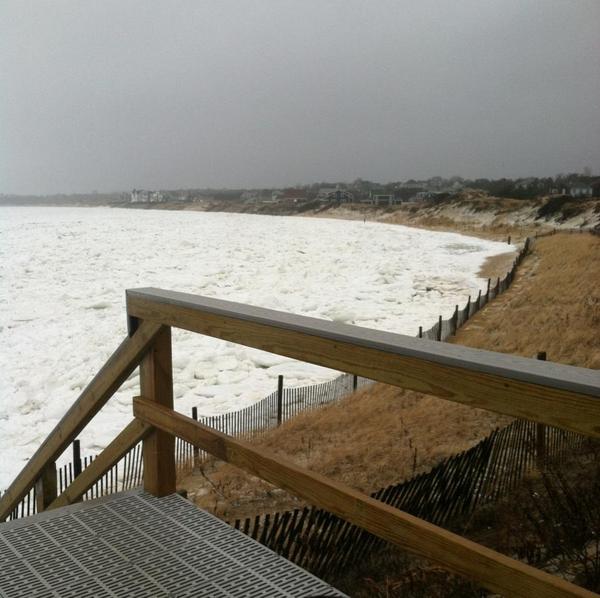
Before the storm: Icy blue ocean at West Dennis Beach, Mass. 3 Jan 2018 (photo by Barb Lambdin)
On the day before the “bomb cyclone” hit Massachusetts my sister-in-law, Barb Lambdin, sent me two photos of the frozen ocean at West Dennis Beach, Cape Cod. Intrigued by the coming storm, I asked her to take more photos when it hit.
The photo locations are part of the story:
Before the storm: West Dennis Beach on the ocean side.
During the storm: Corporation Beach in the protected middle of the bay shore.
Map of Massachusetts. 1: oceanside photos at West Dennis Beach, 2: bayside photos at Corporation Beach
BEFORE THE STORM:
Above, the ocean was so calm on 3 January 2018 that ice had formed in flat sheets and blue-green water ponded on top.
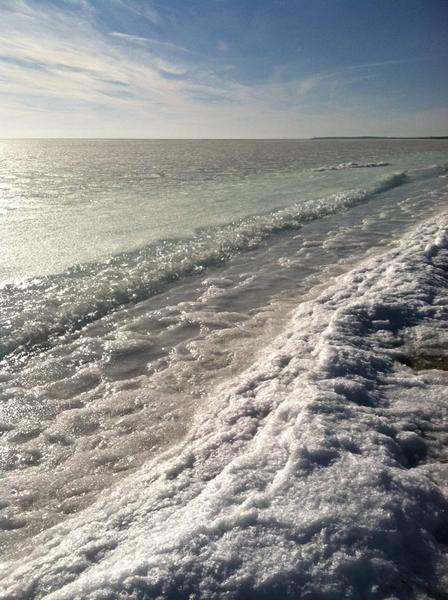
The waves were small and slushy (below). Barb calls them Frozen Margarita waves.
Before the storm, slushy waves at W Dennis Beach, MA 3 Jan 2018 (photo by Barb Lambdin)
DURING THE STORM:
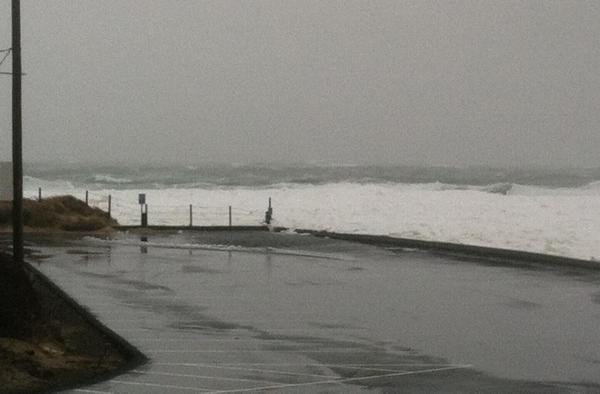
On 4 January it was too windy and dangerous on the ocean side so Barb went to the bay side at Corporation Beach. The two photos below were taken at high tide.
Keep in mind that this is the calm side of Cape Cod yet the waves are high and about to flood the parking lot. I have never seen waves break at Corporation Beach!
During the storm: Corporation Beach at high tide. Dennis, MA 4 Jan 2018 (photo by Barb Lambdin)
Four years ago we experienced the Polar Vortex of 2014 when the jet stream wobbled southward. It’s happening again. And it’s a feature of climate change.
(photos by Barb Lambdin. Massachusetts map from Wikimedia Commons. Temperature map from the National Weather Service; click on the images to see the originals)
This morning (28 December 2017) it’s 3o F in Pittsburgh with a forecast high of 15o F = 20 degrees below normal. Less than a week ago the low was 40o with a high of 57o F. That was 19 degrees above normal. During this temperature swing it rained half an inch on December 23, then puddles froze solid on Christmas Eve night. We had black ice on Christmas Day.
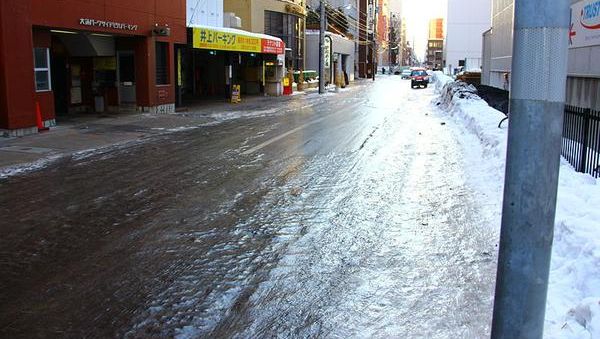
Black ice isn’t really black. It just looks that way because it’s such a thin, smooth coating of clear ice that the dark pavement shows through.
Technically speaking “black ice” forms when pavement looks dry but its porous surface contains water. When that water freezes it’s invisible. So the photo at the top isn’t really “black ice” (it was probably laid down by freezing rain) but who can find a photo of something invisible?
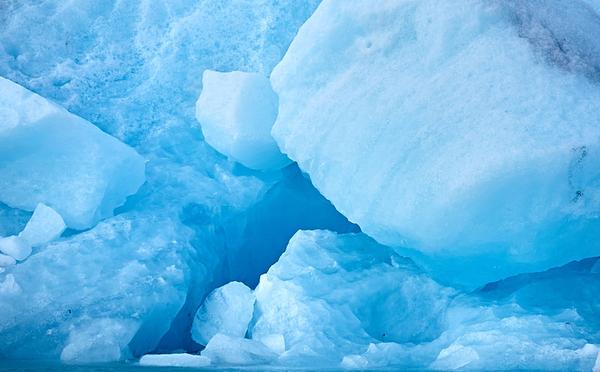
Pittsburgh has black ice but we don’t have blue ice.
Blue ice is very old ice from the lowest layers of a glacier. It’s blue because the weight of the glacier above compressed all the air bubbles out of it. The lack of air makes the ice look blue like sea water.
So… black ice occurs where temperatures move above and below freezing (Pittsburgh). Blue ice occurs where it’s so cold that the glaciers are centuries old (Iceland).
Pittsburgh or Iceland? Where would you rather be on this cold day?
Be careful out there! If you fall on the ice you’ll be black and blue.
(photos from Wikimedia Commons. Click on the images to see the originals.)
Barrow, Alaska as seen from the air, Aug 2007 (photo from Wikimedia Commons)
The computer said, “Those numbers are too high. They must be in error. Throw them out.” And so Barrow, Alaska disappeared from the climate analysis database.
Fortunately a lot of people missed Barrow when it was gone. In fact they suspected it might disappear some day because it’s so unusual. The error was found quickly and the raw data will be restored.
What happened?
This month more than a year’s worth of temperature data for the northernmost point in the U.S. — Barrow, or Utqiávik, Alaska (see arrow) — automatically disappeared from the National Centers for Environmental Information temperature analysis system because it looked so out of whack.
Barrow, Alaska locator map (image from Wikimedia Commons; arrow added)
Why would a computer throw away real data?
Computers that collect automated weather data have algorithms that test for wild abnormalities so that instrument errors are isolated (rejected) from the clean data calculations. For instance, when a weather thermometer breaks or goes offline, the temperature is recorded as “zero.” When this happens in July in Pittsburgh it’s so obviously incorrect that the software rejects it. Algorithms for climate analysis are even more stringent because a change to an instrument’s location can look like a trend even though it isn’t.
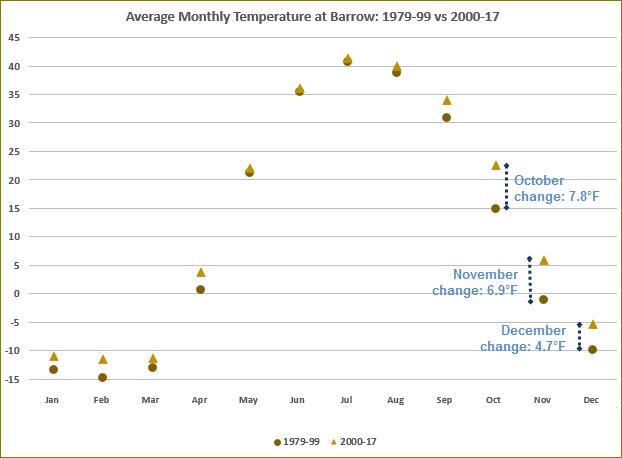
Here’s why Barrow looks crazy to a computer. This graph by Derek Arndt at climate.gov shows circles for Barrow’s 1979-1999 average monthly temperatures, triangles for 2000-2017. Notice that for most of the year those 20-year averages are pretty close but for October, November and December they’re widely different. Computers don’t like that!
Average Monthly Temperature at Barrow in two eras 1979-1999 vs 2000-2017 (graph from NOAA)
Barrow is experiencing rapid warming because there’s a lot less sea ice than there used to be. When ice crowds the shore in the fall, Barrow gets cold, but now the ice recedes so far in the summer that it takes months longer to reach the town.
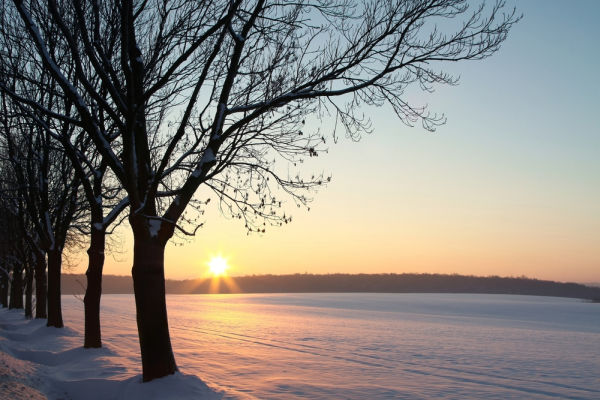
Winter sunset (photo by Paul Aniszewski from Shutterstock)
Today is the shortest day in the northern hemisphere, the official start of Winter. But don’t worry. Spring comes faster than any other season.
Because the Earth doesn’t move at a constant speed in its elliptical orbit, the seasons are different lengths. From a warmth perspective, the northern hemisphere is lucky. Our winter is the shortest season.
Winter, December-to-March: 89.0 days from winter solstice to vernal equinox
Spring, March-to-June: 92.8 days from vernal equinox to northern summer solstice
Summer, June-to-September: 93.6 days from the summer solstice to the autumnal equinox
Autumn, September-to-December: 89.8 days from the autumnal equinox to the winter solstice
So after the sun stands still at 4:28pm UTC (Universal Time) — 11:28am in Pittsburgh — it’ll start its journey northward.
Spring will be here soon.
p.s. Groundhog Day is halfway between the winter solstice and vernal equinox. It’s something to look forward to.
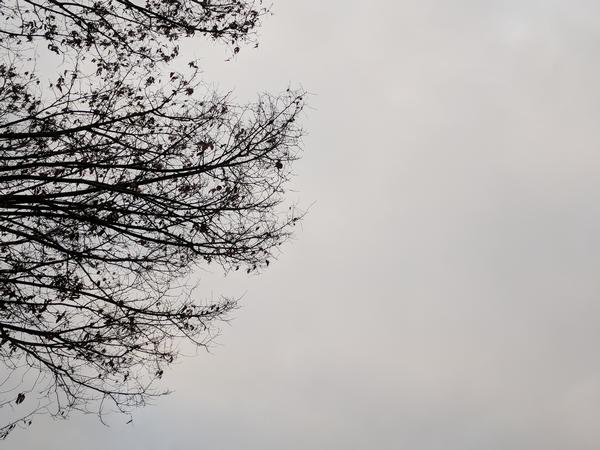
Overcast sky above a bare tree, Pittsburgh, PA, 11 Dec 2017 (photo by Kate St. John)
We’ve had a long run of overcast days that began on Sunday, December 10.
On Monday morning Pittsburgh looked gray outside my window.
Overcast sky in Pittsburgh, 11 Dec 2017, 8:15am (photo by Kate St. John)
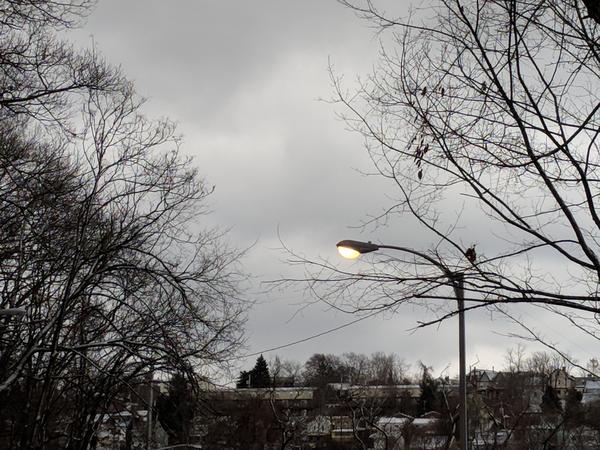
On Tuesday it was so gloomy that a few street lights came on in Schenley Park at 11:30am.
Overcast sky in Pittsburgh, 12 Dec 2017, 11:30am (photo by Kate St. John)
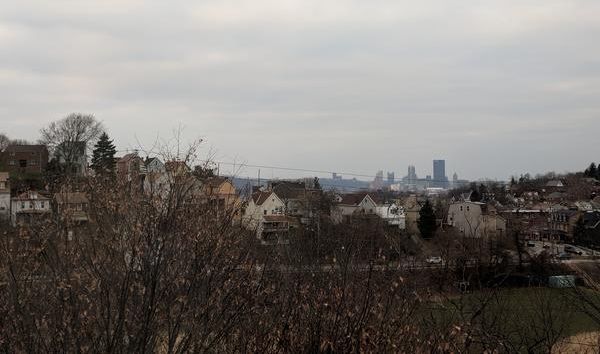
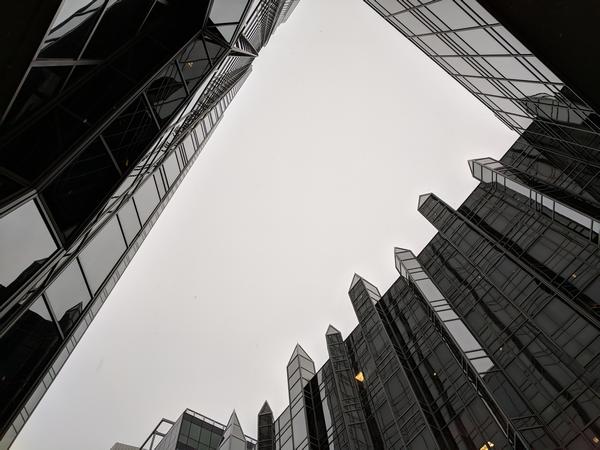
On Wednesday we had a splash of sun in the morning, then overcast skies and snow. Here’s the sky above PPG Place downtown on Wednesday at 4:15pm. The rest of the week was partly overcast, too.
The sky above PPG Place on Fourth Avenue, 13 Dec 2017, 4:15pm (photo by Kate St. John)
This is not just one layer of clouds. It’s often one or two low layers of broken clouds overtopped by an overcast layer.
12 Dec 11:35am … BKN008 OVC039 = Broken clouds at 800 feet, Overcast at 3,900
13 Dec 4:16 pm … FEW014 OVC024 = Few clouds at 1,400 feet, Overcast at 2,400
16 Dec 7:00am … OVC041 = Overcast at 4,100
My husband tries to see the good in everything. He sees value in a rainy day (we need rain on a regular basis) so he wondered, “What’s the value of an overcast day? What good is it?”
Ummm… perhaps… You can’t get a sunburn when the clouds are this thick.
Though the ocean will never flood Pittsburgh, I’m still fascinated by the rising sea.
Back in October I wrote about sea level fingerprints, the pattern of tiny elevation changes in sea level caused by uneven gravitational forces around the globe. The highest ocean peaks are in the tropics, the deepest valleys are near melting glaciers. As the land loses mass (ice) its gravitational pull decreases and it stops hugging the ocean to its shore. The water has to go somewhere so it goes to the tropics.
This means that glacial melt affects sea level rise in two ways:
It adds water to the ocean that used to be sequestered on land and …
It alters the sea level fingerprint, lowering the ocean nearby and raising it far away.
If you do the complicated math, you can find out how individual melting glaciers will affect sea level at specific locations.
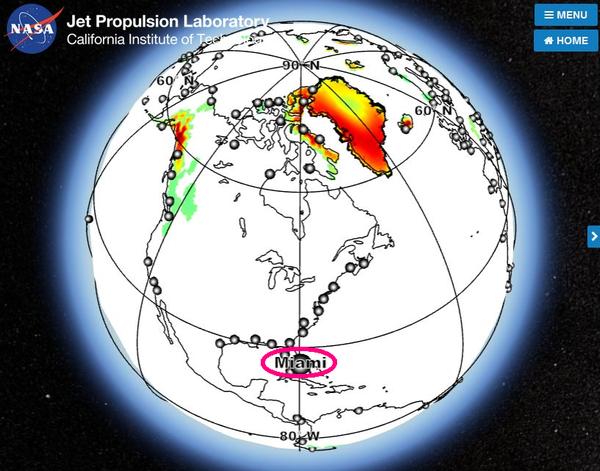
Last month, scientists at NASA Jet Propulsion Lab did just that when they published a paper in Science Advances and an online tool that illustrates how glaciers will affect 293 coastal cities.
Let’s take a look at Miami.
Almost half the sea level rise in Miami will be caused by glaciers (47.4% of total sea level rise) and almost half of that will be Greenland’s fault (20% of total sea level rise). That’s why Greenland is so red in the screenshot above.
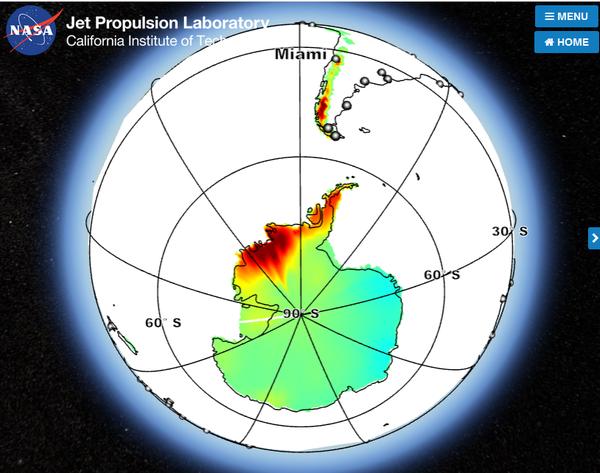
The next highest glacial contributor in Miami will be Antarctica (12% of total sea level rise). In the screenshot below you can see that South American glaciers help, too.
In fact, the entire northern hemisphere is endangered by Antarctica’s melting ice because it’s so far away. Ironically the safest place to be is right next to a melting glacier. Sea level will go down at those sites.
(*) Pittsburgh’s Point is 711 feet above sea level. My immediate family lives 10 to 25 feet above sea level in Virginia and Florida.
(screenshots of glacial contribution to sea level rise in Miami from the online tool at NASA Jet Propulsion Lab. On the first screenshot I added a pink circle to highlight Miami. Click on the images to use the online tool.)