Category Archives: Weather & Sky

Tornadoes in November

Damage in Williamsfield, Ohio from 5 Nov 2017 tornado (photo from National Weather Service, Cleveland)
Damage from 5 Nov 2017 tornado in Williamsfield, Ohio (photo from National Weather Service, Cleveland)

13 November 2017

You know things are strange when there’s an outbreak of 15 tornadoes in Ohio and western Pennsylvania in November.

Just over a week ago, on Sunday November 5, 2017, a cold front passed over the southern Great Lakes and Ohio River Valley.  Before the front arrived it was humid and around 70 degrees — as much as 17 degrees above normal — so the front’s leading edge spawned 15 tornadoes in Ohio and PA.

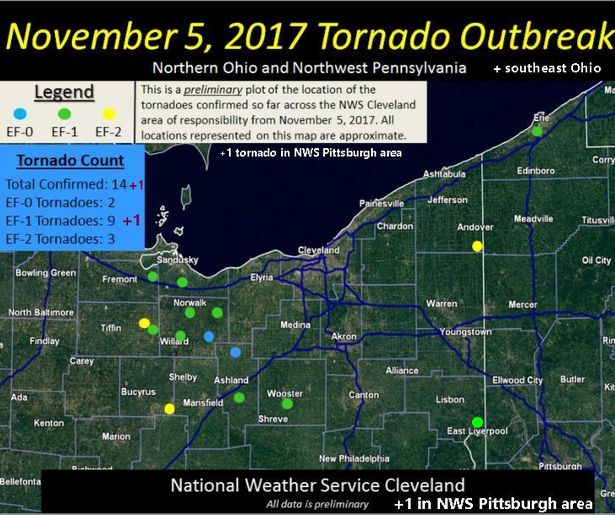
The National Weather Service in Cleveland mapped 14 of them in their region.  I’ve added the EF-1 tornado in Calcutta, Ohio just west of Beaver County, PA reported by the National Weather Service in Pittsburgh.  Yes, 15 tornadoes!

Map of Nov 5, 2017 Tornado Outbreak in Ohio and northwestern PA (map from National Weather Service Cleveland. Added 1 tornado reported in NWS Pittsburgh region in Columbiana County, Ohio)
Map of Nov 5, 2017 Tornado Outbreak in Ohio and northwestern PA (map from National Weather Service Cleveland. I added 1 tornado reported by NWS Pittsburgh region in Columbiana County, Ohio)

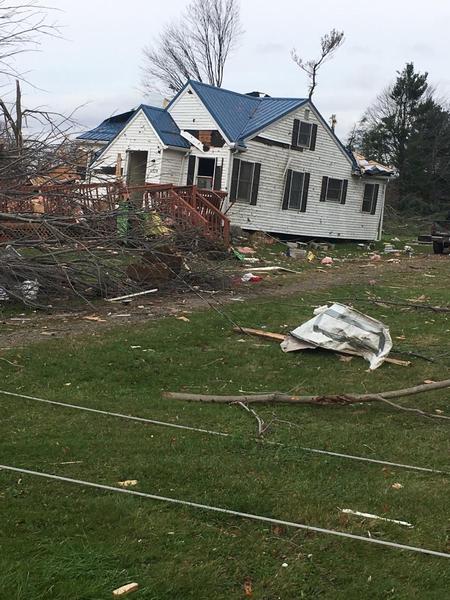
The tornado in Williamsfield, Ashtabula County, Ohio was one of the strongest, an EF-2 with winds of 127 miles per hour.  It cut a swath 7 miles long ending at the western shore of Pymatuning Lake.  The damaged house shown above makes me glad I wasn’t there!

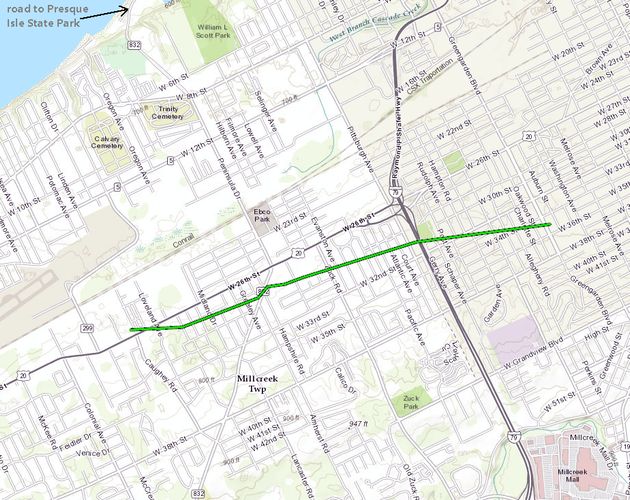
Calcutta, Ohio’s EF-1 tornado in the Pittsburgh Forecast Area blew down some trees and damaged the local YMCA.  And an EF-1 tornado blew through the city of Erie, PA for 2.4 miles, downing trees and crossing I-79 on its way.  Here’s its path through a very populated area.

Map of tornado path in Erie, PA on 5 Nov 2017 (map from National Weather Service, Cleveland)

Pittsburgh’s National Weather Service office points out how rare even one tornado is for our forecast area in November:

This [Calcutta, Ohio tornado] is the 14th confirmed tornado so far this year in our county warning area. On average, we see five tornadoes a year. This is the first November tornado since 2003 /14 years/ in New Philadelphia, Ohio. This is the 5th tornado in November for Columbiana county since 1950.

from Pittsburgh NWS

Experts say that climate change increases the frequency of severe weather.  I’d say that 15 tornadoes in November look like a good example.

p.s. From Nov 5 to Nov 10, 2017 the temperature in New Philadelphia, Ohio went from 17 degrees above normal to 15 degrees below normal.  Yo-yo weather.

(photo and maps from the National Weather Service in Cleveland. 14-tornado map altered to include the EF-1 tornado in Calcutta, Ohio reported by the National Weather Service in Pittsburgh. Click on the images to see the originals)

The Sky Last Week

Sunset as seen from the Roberto Clemente Bridge,Pittsburgh, 21 October 2017 (photo by Kate St.John)
Sunset at the Roberto Clemente Bridge, Pittsburgh, 21 October 2017 (photo by Kate St.John)

Last week the sky put on a show in Pittsburgh.  Here are just a few of its moods, October 21 to 24, 2017.

A clear blue sky with one colorful tree, Youghiogeny Bike Trail, 22 October 2017 (photo by Kate St. John)

A double rainbow over Pittsburgh, 23 October 2017, 7:40am (photo by Kate St. John)

Beautiful clouds over Schenley Park, 24 October 2017 (photo by Kate St. John)

Disappointing Fall Colors

American beech leaf, 17 October 2017 (photo by Kate St. John)

By now fall colors ought to be at their peak in southwestern Pennsylvania but that isn’t the case this year.

Above, an American beech leaf shows hints of green and yellow but is already mostly brown.  The view below at Moraine State Park on Tuesday October 17 shows a landscape that’s still green or brown and leafless.  There are no beautiful reds and yellows.

Lake Arthur at Moraine State Park, 17 October 2017 (photo by Kate St. John)

Emerald ash borer killed the trees that used to contribute yellow, orange and violet.  This year September’s heat and drought suppressed the maples.

We’re still waiting for the oaks to change color but they will turn a muted red.

Maybe next year.


(photos by Kate St. John)

Sea Level Fingerprints

Fingerprint image from Wikimedia Commons

As ice sheets melt around the world, fresh water that used to be held on land is pouring into the ocean and sea level is rising.  But it’s not rising uniformly.  The transfer of mass (water) from land to sea causes changes in Earth’s gravity field.  Mirroring the ripples in gravity, the water is high in some places and low in others like the ridges on a fingerprint.

The mysteries of gravity *

Gravity is a force of attraction.  It works on everything and in both directions. The Earth’s mass pulls you toward it while your mass pulls Earth toward you.  The bigger the mass, the stronger the object’s gravitational pull.  Greenland with an ice sheet on top has more mass than Greenland without one, so as the ice melts Greenland’s gravitational pull goes down.

As Greenland’s gravity wanes it doesn’t hug the ocean to its shore like it used to.  The water has to go somewhere so it rises in the tropics.  The effect is tiny, measured in millimeters per year.   The pattern is called a sea level fingerprint.

The pattern revealed

Many things contribute to sea level at any given point including the Moon’s gravitational pull (causing tides) and the wind (causing waves) so it took lots of data and some serious number crunching to reveal Earth’s gravitational fingerprint.  The data came from the GRACE satellite project.

GRACE satellites have been circling the Earth since 2002, measuring the pull of gravity on the globe below.  (Here’s how GRACE works.)  Each orbit provides a snapshot.  Years of data show the change in gravity over time.  Most gravitational changes are due to the movement of water, especially groundwater.

Using GRACE data, scientists from NASA and the University of California Irvine mapped gravitational changes affecting sea level from 2002 to 2014, shown on the map below.  Blue means low water, red is high. The calculations were verified using readings of ocean-bottom pressure from stations in the tropics.

Sea level fingerprints (patterns of variation in sea level rise) calculated from GRACE satellite observations, 2002-2014. The blue contour (1.8 millimeters per year) shows the average sea level rise if all the water added to the ocean were spread uniformly around Earth. Image credit: NASA/UCI
Sea level fingerprints (patterns of variation in sea level rise) calculated from GRACE satellite observations, 2002-2014. The blue contour (1.8 millimeters per year) shows the average sea level rise if all the water added to the ocean were spread uniformly around Earth.
Image credit: NASA/UCI

Notice that the ocean has receded the most near Greenland at the rate of -2.5 mm/year.  That’s 32.5 mm or 1.28 inches in the 13 years that GRACE measured it.  As NASA explains:

The loss of mass from land ice and from changes in land water storage increased global average sea level by about 0.07 inch (1.8 millimeters) per year, with 43 percent of the increased water mass coming from Greenland, 16 percent from Antarctica and 30 percent from mountain glaciers.

Click here to read more about the study and see an animated map of sea level changes 2002-2014.

Unfortunately some of the hardest hit places will be tiny Pacific islands and Florida.

Who knew that the sea has a “fingerprint.”


(fingerprint image from Wikimedia Commons; click on the caption link to see the original. Sea level fingerprint map from NASA/UCI joint project using GRACE satellite data)

* p.s. Gravity is so mysterious that I initially described it incorrectly.  Thanks to Dr. Allen Janis, I’ve corrected the description. See his comment below.

Warming Up to the Next Ice Age

screenshot from This Is Not Cool with Peter Sinclair, Yale Climate Connections

11 October 2017

The ocean is warming, the ice sheets are melting, and the sea is rising. Does global warming mean we’ll be warmer here in the northern hemisphere?  Maybe not.

In this video by Yale Climate Connections, Jørgen Peder Steffensen, an expert in ice core analysis from the Niels Bohr Institute, explains how the Earth can become hotter yet simultaneously plunge Europe into an ice age and North America into ice or drought.  It’s a matter of distribution.

October 2017, video from Yale Climate Connections on YouTube

Here are some points that stunned me in the video:

  • In the last 1 million years there have been 10 ice ages, each lasting about 90,000 years.
  • In-between ice ages are interglacial periods of milder, more stable climate that last about 10,000 years. We’re in an interglacial period right now.  It’s already 11,000 years old.
  • Ice ages are not uniformly cold. Far from it!  Steffensen says, “Inside an ice age the climate is extremely unstable, and you have this sequence of abrupt climate changes [semi-cold to very cold] that happen basically from one year to the next.”
  • Earth can have an ice age in one place and be hot elsewhere.  Ice cores indicate that when Greenland has an ice age, Antarctica is warm — and vice versa.
  • Earth’s current mild climate is due to a global distribution pattern of ocean currents and pressure systems that keep temperatures mild and rainfall moderate.
  • The global distribution pattern can change abruptly.  We don’t know where the trigger is, though we do know our emissions add fuel to the fire.

As Steffensen says, “The climate does not play nice all the time,”

Learn more at Yale Climate Connections:  Humans experimenting with climate’s ‘playing nice’

(screenshot and video from This Is Not Cool with Peter Sinclair, Yale Climate Connections)

Waiting For News … Again

Whimbrel (photo by Arturo Mann from Wikimedia Commons) This is not Hope.
Whimbrel (photo by Arturo Mann from Wikimedia Commons) This bird is not Hope.

News from the Caribbean, especially Puerto Rico, is horrific now that two Category 5 hurricanes have passed through the islands in just two weeks.  Homes, infrastructure and habitat are all destroyed. Our hearts and help go out to everyone affected by these storms.

Images of the widespread damage also have made me wonder:  Did birds survive these hurricanes?

Early this month one particular bird, a whimbrel named Hope, survived Hurricane Irma on St. Croix, U.S. Virgin Islands.  Did she survive Hurricane Maria?  We don’t know yet.

North American whimbrels (Numenius phaeopus) that breed in the tundra of northwest Canada make long migrations to their wintering grounds in the Caribbean and South America.  To understand their migration The Center for Conservation Biology fitted a few of them with satellite transmitters when the birds made migration stopovers on Virginia’s eastern shore.  One bird, nicknamed Hope, was tracked for three years beginning in 2009. Her transmitter was removed after it broke in 2012 but she still wears two colorful leg tags. Every year she returns in late August to St. Croix.

After Hurricane Irma I was encouraged on September 13 when The Center for Conservation Biology sent news that Hope had survived Irma.  The map below provides perspective on this miracle.

St. Thomas and St.John (purple pin markers) took a direct hit from Irma.  Hope spends the fall and winter on St. Croix (blue pin) at Great Pond (yellow star).  She was fortunate that Irma passed more than 45 miles north of her location.  St. Thomas and St. John were so devastated by Irma that survivors were evacuated to Puerto Rico and St. Croix.  (Click here to see a video of Hurricane Irma damage on the U.S. Virgin Islands, posted by the U.S. Navy.)

Then on the night of September 19 Hurricane Maria blew through the islands, passing only 10 miles south of St. Croix.  Hurricane force winds scraped the island for 7.5 hours before slamming Puerto Rico.  The southwestern corner of St. Croix was hardest hit.

As with Hurricane Irma it will take a while to find out what happened.

And I wonder: Did Hope make it through Maria, too?

We’re waiting for news … again.

Read more about Hope surviving Hurricane Irma — and see photos of her — in this article at The Center for Conservation Biology.


(photo of a whimbrel (this is not a photo of Hope) by Arturo Mann via Wikimedia Commons; click on the image to see the original)

p.s. For more news of the Virgin Islands see the Virgin Islands Daily News.

Rainbow Wonders

Double rainbow in my neighborhood at dusk, 14 Sept 2017 (photo by Kate St. John)

Last Thursday evening my husband and I were treated to a gorgeous double rainbow with parallel color bands under the main arc.  What are these wonders and what causes them?

First, some fascinating basics: Rainbows are caused by light hitting water droplets and being reflected, refracted and dispersed by them:

We saw the rainbow at dusk while the sun peeked below rain clouds and were surprised we could see the entire arc. Only those located at the geometric center of the rainbow, the antisolar point, can see it end to end.

Rainbow panomara (photo by Rick St. John)

Have you ever noticed that the sky under the rainbow is brighter than the sky outside it?  True!  Click here for an explanation (fourth paragraph).

And then there’s the fancy stuff: the double rainbow and the extra bands under the arc.  To illustrate them I’ll use this photo from Alaska that shows all of the features at the same time. Click on the image to open a high definition version in a new window and see them up close.

Double rainbow and supernumerary rainbows on the inside of the primary arc, Alaska (photo by Eric Rolph via Wikimedia Commons)
Double rainbow and supernumerary rainbows on the inside of the primary arc, Wrangell-St. Elias National Park, Alaska (photo by Eric Rolph via Wikimedia Commons)

Double rainbows happen when light bounces twice inside the raindrops before it exits.  The light goes inside, reflects off the back wall, reflects off the front wall, and then exits.  Double rainbows are parallel to the main rainbow, are not as bright, and their colors are reversed — red-to-violet instead of violet-to-red.  I never noticed that. I’ll have to watch for it next time.

The faint color bands just under the main rainbow arc are called supernumerary rainbows.  Wikipedia says they cannot be explained using classical geometric optics but they occur when the water droplets are less than 1 mm in diameter.  Fancy rainbows are complicated!

And finally, the end of the rainbow. From our vantage point it was in front of that tree on the horizon.

End of the rainbow in my neighborhood, 14 Sept 2017 (photo by Kate St. John)

Irish legend has it that leprechauns hid their pots of gold at the end of the rainbow. I wonder whose house was there.

Rainbows move away as you approach.  There’s no way to know.


(photos of neighborhood rainbow by Rick & Kate St. John. Alaskan rainbow by Eric Rolph via Wikimedia Commons)

Watching The Wind

Visualization of Hurricane Irma wind, 10 Sept 2017, 5am (screenshot from the "earth" wind map)
Visualization of Hurricane Irma wind, 10 Sept 2017, 5am (screenshot from the “earth” wind map)

10 September 2017

On Friday afternoon I checked in with my brother while he and his wife prepared for Hurricane Irma at their home in Boca Raton.  Located west of I-95, his neighborhood wasn’t part of the mandatory evacuation order but everyone was getting ready and planning to throw a “good luck” party Friday night. They expected to hide indoors until the storm is over — probably midday Monday.  All were hoping Irma would go west and so far that’s what she is doing.

Concerned for my friends and relatives in Florida I’ve been monitoring Hurricane Irma on the National Hurricane Center’s website at www.nhc.noaa.gov.   My brother suggested watching the wind at windy.com and that reminded me of the similar “earth” website.

Watch the wind at these links, centered on Marco Island, Florida along the path of the storm.

Move the map around and you’ll see strong wind blowing onshore toward Georgia.  That’s why there’s a storm surge warning in Savannah.

There’s one thing these maps can’t show.  Hurricanes spawn many tornadoes but they don’t appear on the wind maps.  Right now there’s a tornado watch in Boca Raton until noon on Monday.  Yikes!

(screenshot from earth.nullshool.net on 10 Sept 2017, 5am. Click on the image to see the current wind map)

UPDATE at 11:30pm on Sept 10:  My brother reports that they are OK at home in Boca Raton.  The power went out for eight hours but came on around 11pm. They’ll go outside Monday morning to see what happened to the landscape.