Category Archives: Weather & Sky

Like A Cork

We’re in for some interesting weather though it probably won’t look as dramatic as the cold front pictured above.

Last night the National Weather Service Pittsburgh forecast discussion said, “Showers becoming likely daytime Thursday with the passage of a mature occluding cold front. NAM model profiles show the cold frontal passage can also be accompanied by wind gusts up to 30 mph.”

I had never heard of an occluding front let alone a mature one (obviously, I haven’t been paying attention), so I had to look it up.

Occluded means blocked or stopped up.  An occluding cold front is one that overtakes a warm front, jamming it in a wedge between the cold air ahead of the warm front and the new cold air mass overtaking it.  The warm air has nowhere to go but up.  Cold air floods in and the warm air rides atop it like a cork on water.

It looks like this — before and after — as the cold front approaches from the left, catches up to the warm front and forces it up.  (Technically this drawing shows a “cold occlusion.”)

The practical result is that we had cold air early this week, warm air today (the warm front), and cold air tomorrow.  The weather map shows the actual occlusion will track north of us.

The forecast also said, “As what often occurs with these maturing systems there can be a dry slot passage Thursday night before the ensuing cold upper low passes eastward through the upper Ohio Valley Friday.”  So it will be dry on Friday.

The cork will rise tomorrow.

(photo from Wikimedia Commons of a cold front moving rapidly along the Rappahannock River. Occlusion diagram from Wikimedia Commons. Click on the images to see the originals.)

p.s. 10/17, 6:23 pm, Thursday’s forecast more includes the possibility of a severe thunderstorm & Friday has a chance of showers. Things change all the time!

Making Waves

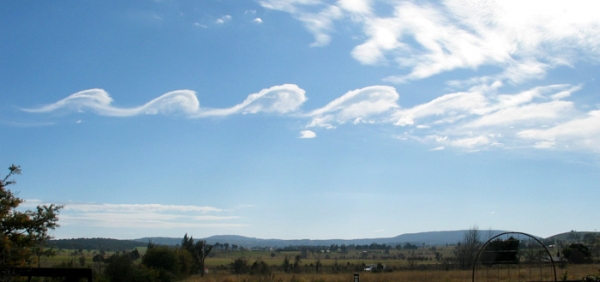
These rare Kelvin-Helmholtz clouds look like waves on the ocean.

In fact they are breaking waves generated by the same fluid dynamics that creates wind-driven waves on water.

Both are caused by Kelvin-Helmholtz instability which occurs at the boundary where two fluids flow by each other at different speeds or densities.  The air above these clouds is moving faster left-to-right than the air below them.  The boundary is very turbulent and becomes more so when the waves break.

Kelvin-Helmholz instability can be described mathematically and its effect plotted over time.  This silent video by VanjaZ shows a yellow fluid on top flowing faster than the black fluid on the bottom.  Talk about turbulence!


We rarely see K-H clouds because the atmosphere has to be just right to make them stand alone. The curling waves disappear in seconds, wiped out by chaos as soon as they break.

(photo by GrahamUK on Wikimedia Commons; video by VanjaZ on YouTube)

Help Categorize Hurricanes

The National Climate Data Center has 300,000 images of tropical cyclones (hurricanes) from 30 years of satellite observations.  Unfortunately the method for categorizing them has changed over time and from place to place.

Is a cyclone labeled “Category 3” in 1988 the same intensity as a Category 3 today?  Maybe not.

The database needs to be standardized but reclassifying this many storms is an impossible task for NCDC staff.  How can they solve this problem?  Crowdsource it!   Once you know the color scheme, anyone can easily recognize patterns and pick similar images.

And so CycloneCenter.org was born.

Pictured above is Hurricane Gilbert from 1988.  It has the classic cyclone swirl and an obvious eye in the middle.  The intensity is also shown in color.  Dark blue clouds are the very tallest, then red, orange, yellow, with pink-gray the lowest.  Gilbert is one intense storm!

Now you’re ready to try your own storm.  Here’s what you’ll find at CycloneCenter.org:

  1. The very first time you visit:  Watch the demo and click on the “?” Help symbols.  If you want, you can create a login so you get credit for your storms.
  2. Occasionally the first step presents you with two images and asks you to click on the more intense storm.
  3. For every storm:  A single image is presented on the left.  Pick its pattern:  Eye, Embedded center, Curved band, Shear, Other.  Click the “?” Help buttons to get used to the patterns.
  4. Now pick the image that most closely matches your storm.
  5. Repeat for #3 and #4 for five more time-lapse images of the same storm.

Don’t worry if your first attempt seems clumsy.  There is no right answer.  Everyone can do it.  All of us can help.

Read more about the project here or go directly to CycloneCenter.org to try your eye on a hurricane.

(image of Hurricane Gilbert, 1988, from the Cyclone Center)

Fast Melt

This month the Arctic sea ice melted to its smallest extent since satellite monitoring began.  To see the dramatic change in only 33 years, click here and drag your mouse over the map.

We are used to hearing that the ice has melted, but the surprise this year is that no one thought it would happen this fast. Scientists thought the ice was thick and needed real warmth to melt. The models said it would take years to get this bad.

Apparently not.  Apparently the ice is so thin that a strong wind can break it into slush that melts quickly.

And there was a strong wind.

The NASA animation above shows arctic wind circulation from August 1 to September 13.  The long red arrows are the fastest winds.

Play the video and you’ll see a storm blow off the coast of Alaska on August 5 and swirl into a cyclone that broke up the ice and opened a large extent of the ocean.

This dramatic melting creates a gigantic feedback loop in which the lack of ice causes temperatures to rise and that causes more ice to melt.

A churning cyclone. A feedback loop. The situation is changing rapidly and brings to mind this verse:

Turning and turning in the widening gyre
The falcon cannot hear the falconer;
Things fall apart; the centre cannot hold;
Mere anarchy is loosed upon the world…”

— from The Second Coming by William Butler Yeats


(video from NASA/Goddard Space Flight Center Scientific Visualization Studio)

Morning Glory

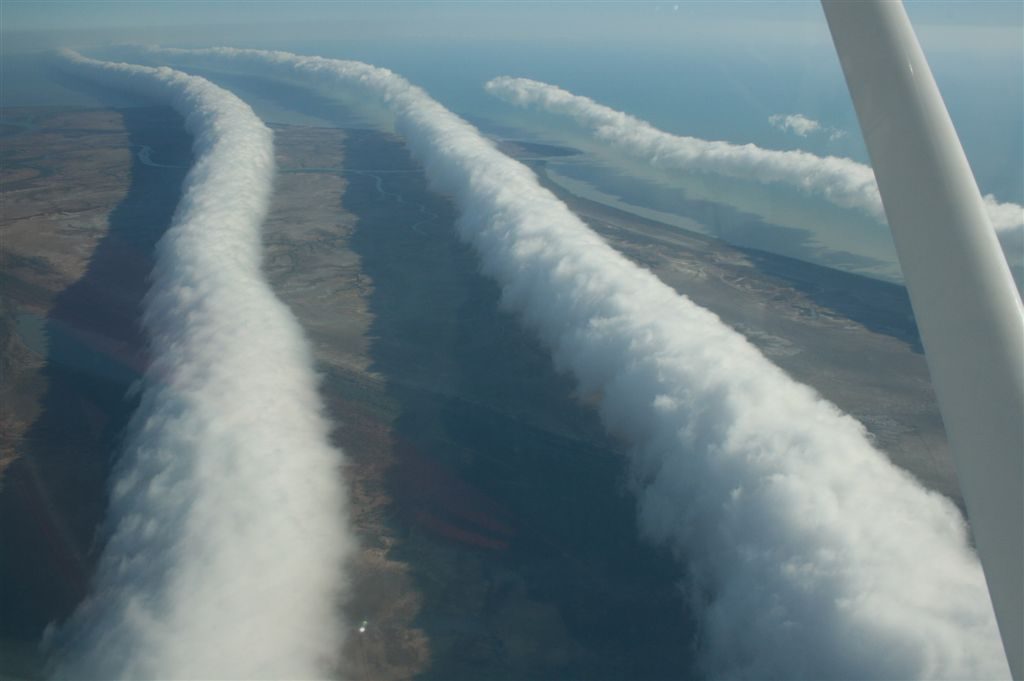
Morning glory clouds, August 2009, Burketown, Queensland, Australia (photo from Wikimedia Commons)

A morning glory is a flower, right?

Yes, and it’s also the name of these very rare roll clouds that stretch as much as 1000 km.  That’s 620 miles, the distance from Pittsburgh to Dallas, Texas!

I’ve never seen a morning glory cloud but the literature says they are low and tubular and appear to be rolling on their horizontal axis.  They travel up to 60 kilometers per hour (37 mph) over a landscape that has no wind at ground level — until they arrive.

Morning glories bring wind with them and such great updrafts on the leading edge that glider pilots flock to the only place on earth where these clouds reliably occur:  northern Australia’s Gulf of Carpentaria from August to November.  Some have ridden these clouds for 500 km (310 mi).

Morning glory clouds can form (rarely) in response to severe thunderstorms but in Queensland they’re caused by sea breezes that flow onshore overnight at the Cape York Peninsula.  The moist air comes from both east and west, meets in the middle over the peninsula, and rises into a stack of cold, turbulent air.  Before dawn the stack is blown westward over the Gulf and causes ripples in the sky, each one carrying a long roll cloud.

Right now it’s spring in Australia and prime season for this rare phenomenon.  In Burketown, Queensland the glider pilots awake before dawn, hoping for glory.

(photo by Mick Petroff via Wikimedia Commons. Click on the image to see the original)

Red Sky At Night

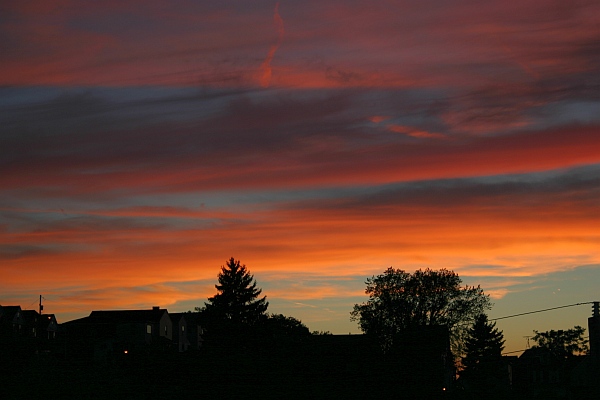
The sunset was gorgeous last night after yesterday’s heavy rain.  It reminded me of the old saying:

Red sky at night, sailor’s delight
Red sky at morning, sailors take warning.

Though this saying is folklore, it’s a fairly accurate way to predict the weather.

When the sun is at a low angle, its light passes through more of the atmosphere and the blue-green wavelengths are stripped out, leaving mostly red.  We see a pretty sunset when the reddish light reflects on the underside of clouds.

Clouds are key to the folklore weather prediction.  They come from the west, they indicate moisture, and they might bring rain or storms.

As shown in last night’s photo, during a red sunset the clouds are close to us and the sky is clear in the far west.  Clear skies in the west mean good weather is on its way.

During a red sunrise, the clouds are overhead or in the west but the clear skies have already passed over to the east.   Morning clouds often indicate bad weather will arrive that day.

Taking a cue from last night’s sunset, I can safely predict that today will be a very fine day.

NOAA says so, too.   😉

(photo by Kate St. John)

Banner Waving

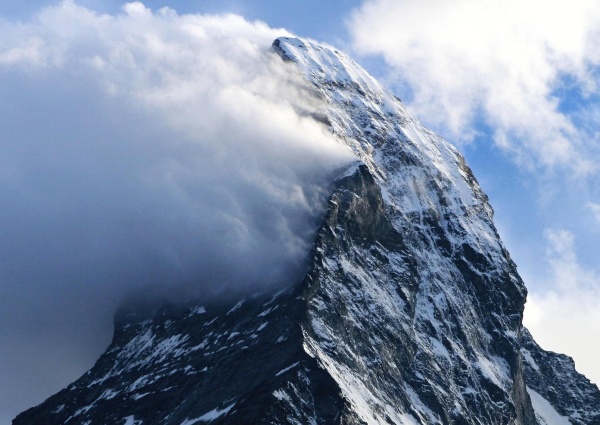
Two weeks ago the mountain was wearing a hat.  Today it’s waving a flag.

Banner clouds are stationary, orographic clouds that only form in high wind on the leeward side of an isolated, steep mountain.  The Matterhorn, pictured above, is famous for them.

Banner clouds are so picky that we’ll never see them in western Pennsylvania simply because we have no isolated steep mountains.

… except …

Under the right moisture conditions a banner cloud can form above or just behind an airplane’s wings. Click here for an example.

Airplanes form banner clouds because there’s lower air pressure on top of their wings (to generate lift).  The lower pressure results in lower temperature which results in condensation.  Hence a cloud.

My favorite banners are the wing tip clouds that look like streamers.

And for a really weird effect, check out this cloud around a fighter jet on the verge of breaking the sound barrier.  The shape is so perfect it’s hard to call it a banner.

(photo by Zacharie Grossen on Wikimedia Commons. Click on the photo to see the original)

Waves and Windows in the Sky

Wave window clouds over Bald Eagle Valley, PA (photo from Wikimedia Commons)

5 September 2012

When I wrote about lenticular clouds last week Tom Stepleton of the Pittsburgh Soaring Club commented on how useful they are for glider pilots — a sure sign of an updraft that will take a glider high and far.

He also mentioned another orographic cloud that’s more common above Pennsylvania’s mountains: the wave.

This photo, taken by a glider pilot, shows two waves with a window over Bald Eagle Valley in north central Pennsylvania.  The clouds are formed by the same wind pattern that creates lenticular clouds but instead of creating a lozenge-shape the long ridge produces a wave.

The best conditions often occur in the fall when a cold front brings northwest winds that hit the mountains at a 90 degree angle.

Pictured here the wind hits the Allegheny Front (on the left) and rises up to create the first wave.  The air drops and creates a window over the valley, then rises again to create the second wave.

The pilot was flying north but I’m sure he saw hawks heading south using the same updraft to make their journey easy. (This photo was taken in autumn; the trees are changing color.)

It would have been a good day to be at the Allegheny Front Hawk Watch … as long as that cloud stayed well above the ground.

(photo by Dhaluza on Wikimedia Commons.  Click on the photo to see the original and read more about it.)

The Mountain is Wearing a Hat

Lenticular cloud over Mt. Hood (photo by Yapin Wu via Wikimedia Commons)

29 August 2012

Smooth clouds like this are my favorite because they look like lozenges or flying saucers.  Sometimes they’re in compound shapes like this “hat” on Mt. Hood.

Lenticular clouds are most common near mountains because the wind hits the mountain, creates an updraft and becomes a large standing wave.  When moisture condenses at the top of the wave, a stationary lenticular cloud forms there.  The long lozenge shapes are usually perpendicular to the wind.  They sure don’t look that way!

When the wind hits the mountain the waves look like this. 

Lee waves and windows (image from Wikimedia Commons)

Notice the stationary clouds at crests A and B. The wind follows the shape of the mountain — twice! The updraft on the windward side of the mountain is provides uplift for glider pilots but the downdrafts can be deadly. There’s a lot of turbulence in those standing waves. Powered aircraft avoid them.

Pittsburgh rarely has lenticular clouds, though a front creates one occasionally.

For really cool clouds you have to visit the mountains.

(photo of cloud by Yapin Wu via Wikimedia Commons. Diagram of wave lift by Dake on Wikimedia Commons.  Click the captions to see the originals.)